All Figures The State of Metabolic Health in America, 2026 Baseline Edition
28 figures · Chapters 1–10
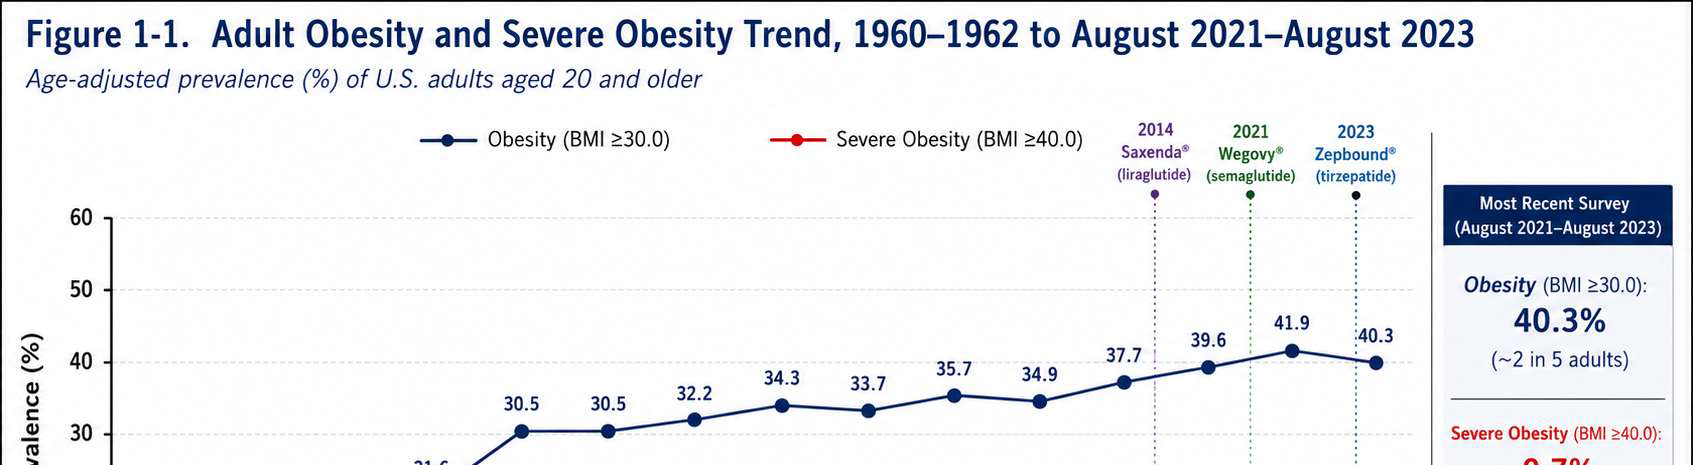
Chapter 1 — The Metabolic Health Landscape Figure 1-1 Adult Obesity and Severe Obesity Trend, 1960–1962 to August 2021–August 2023
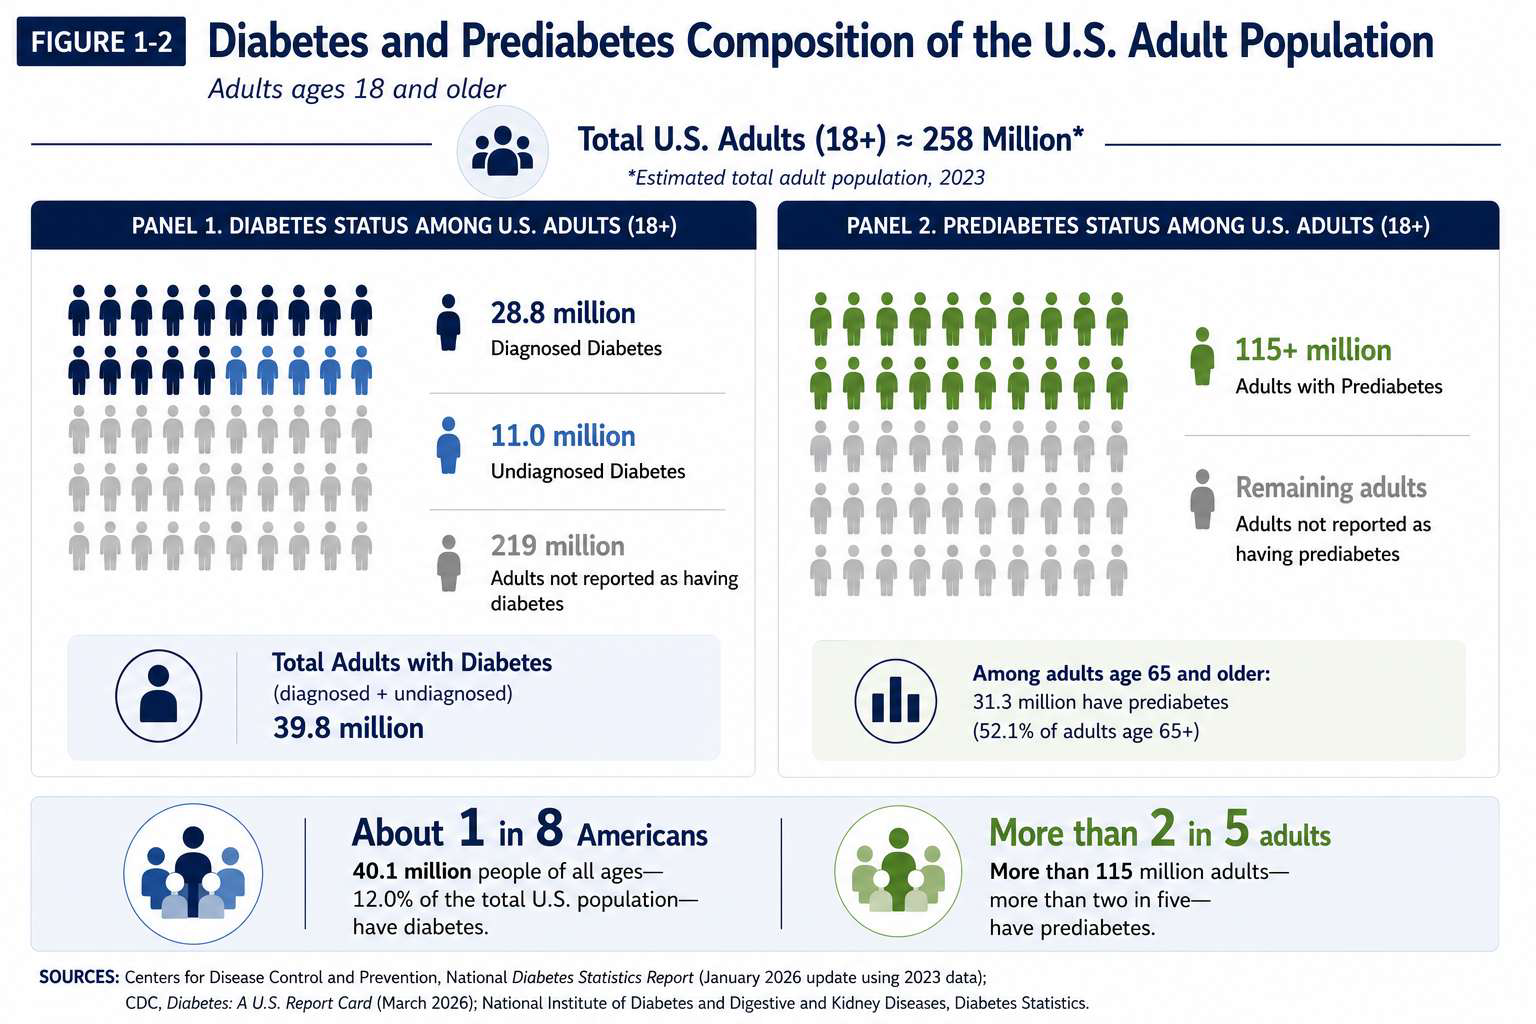
Long-run trend in adult obesity and severe obesity prevalence in the United States, showing sustained increases across six decades. Figure 1-2 Diabetes and Prediabetes Composition of the U.S. Adult Population
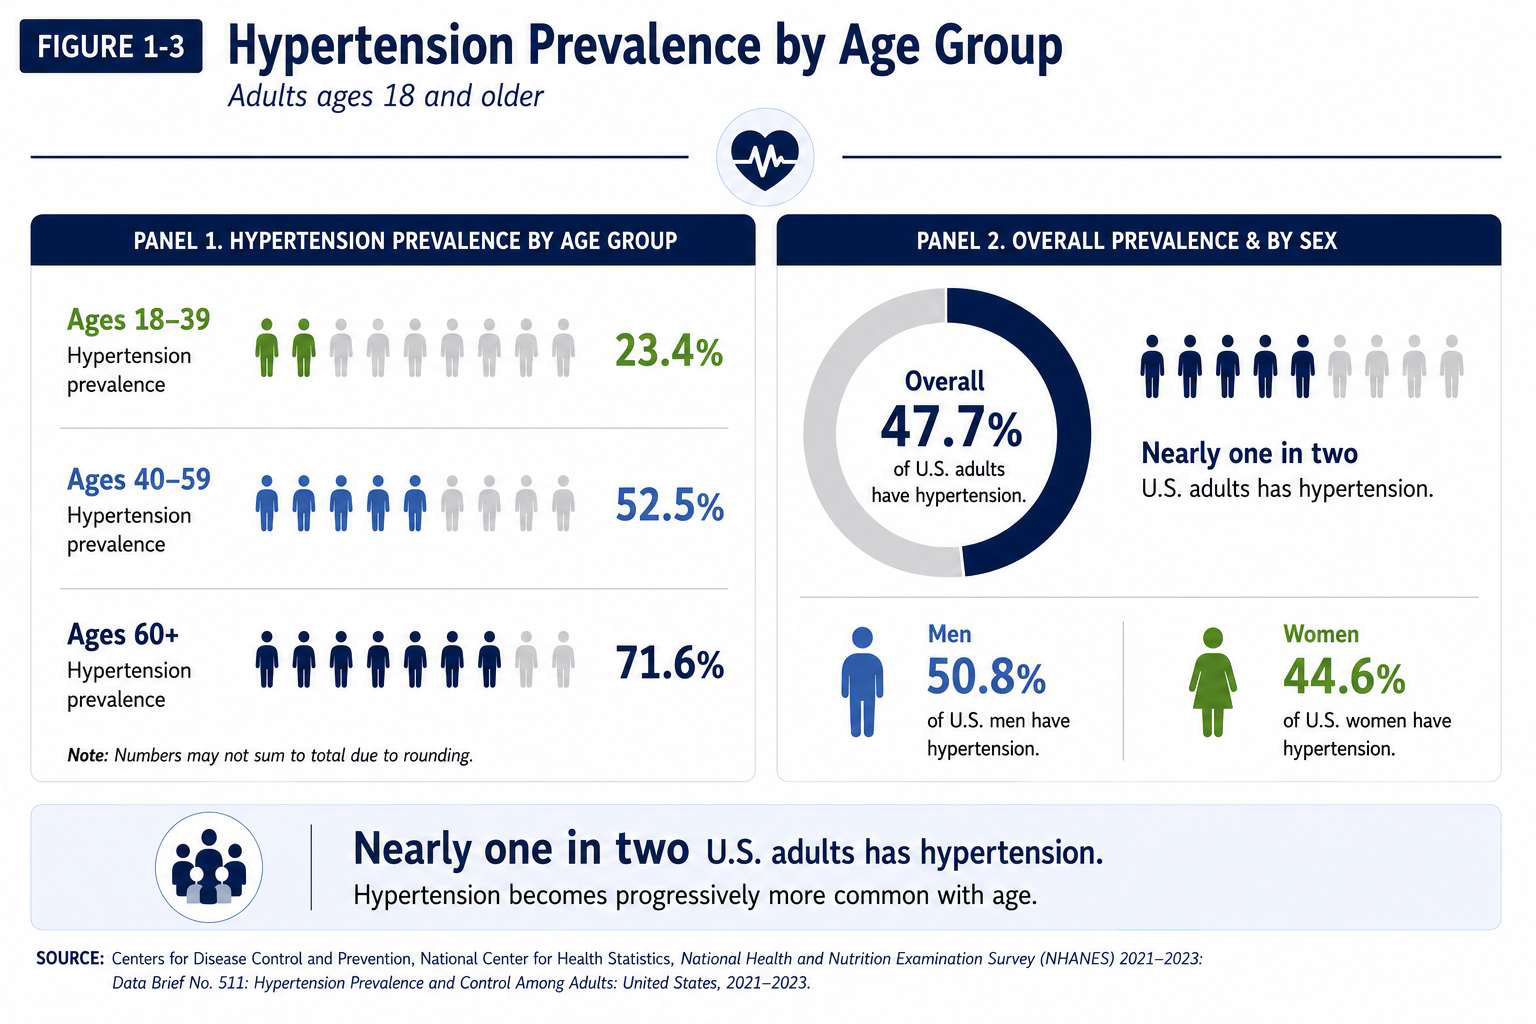
Breakdown of diagnosed diabetes, undiagnosed diabetes, and prediabetes as shares of the U.S. adult population. Figure 1-3 Hypertension Prevalence by Age Group
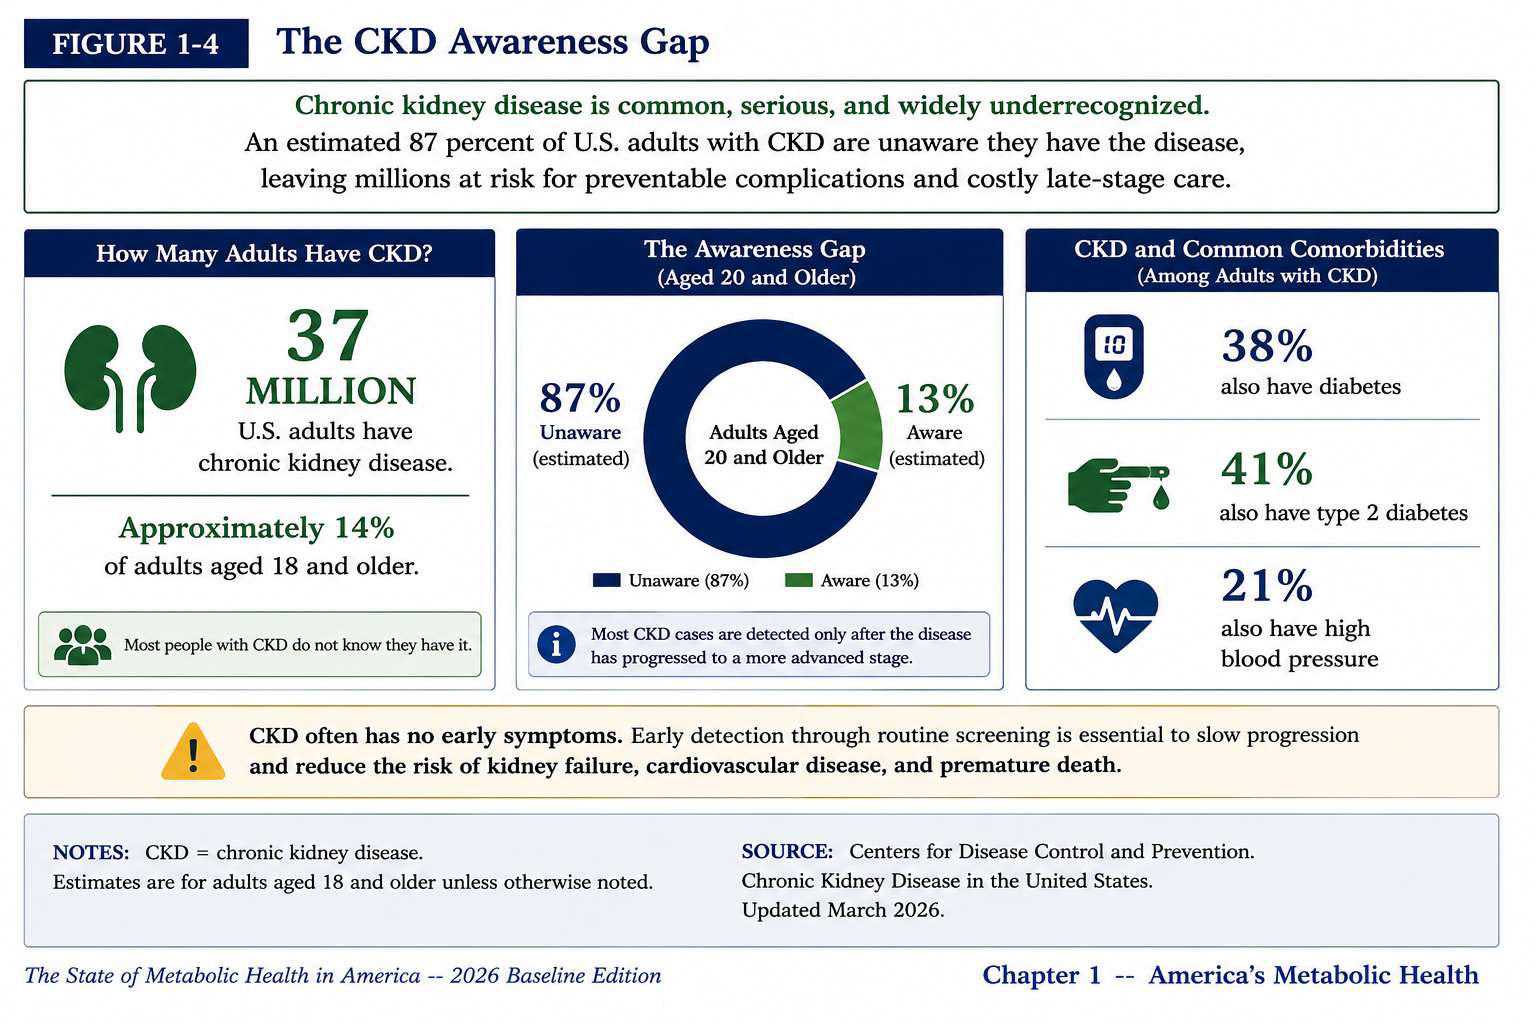
Hypertension prevalence rises sharply with age, with rates exceeding 70% among adults 65 and older. Figure 1-4 The CKD Awareness Gap
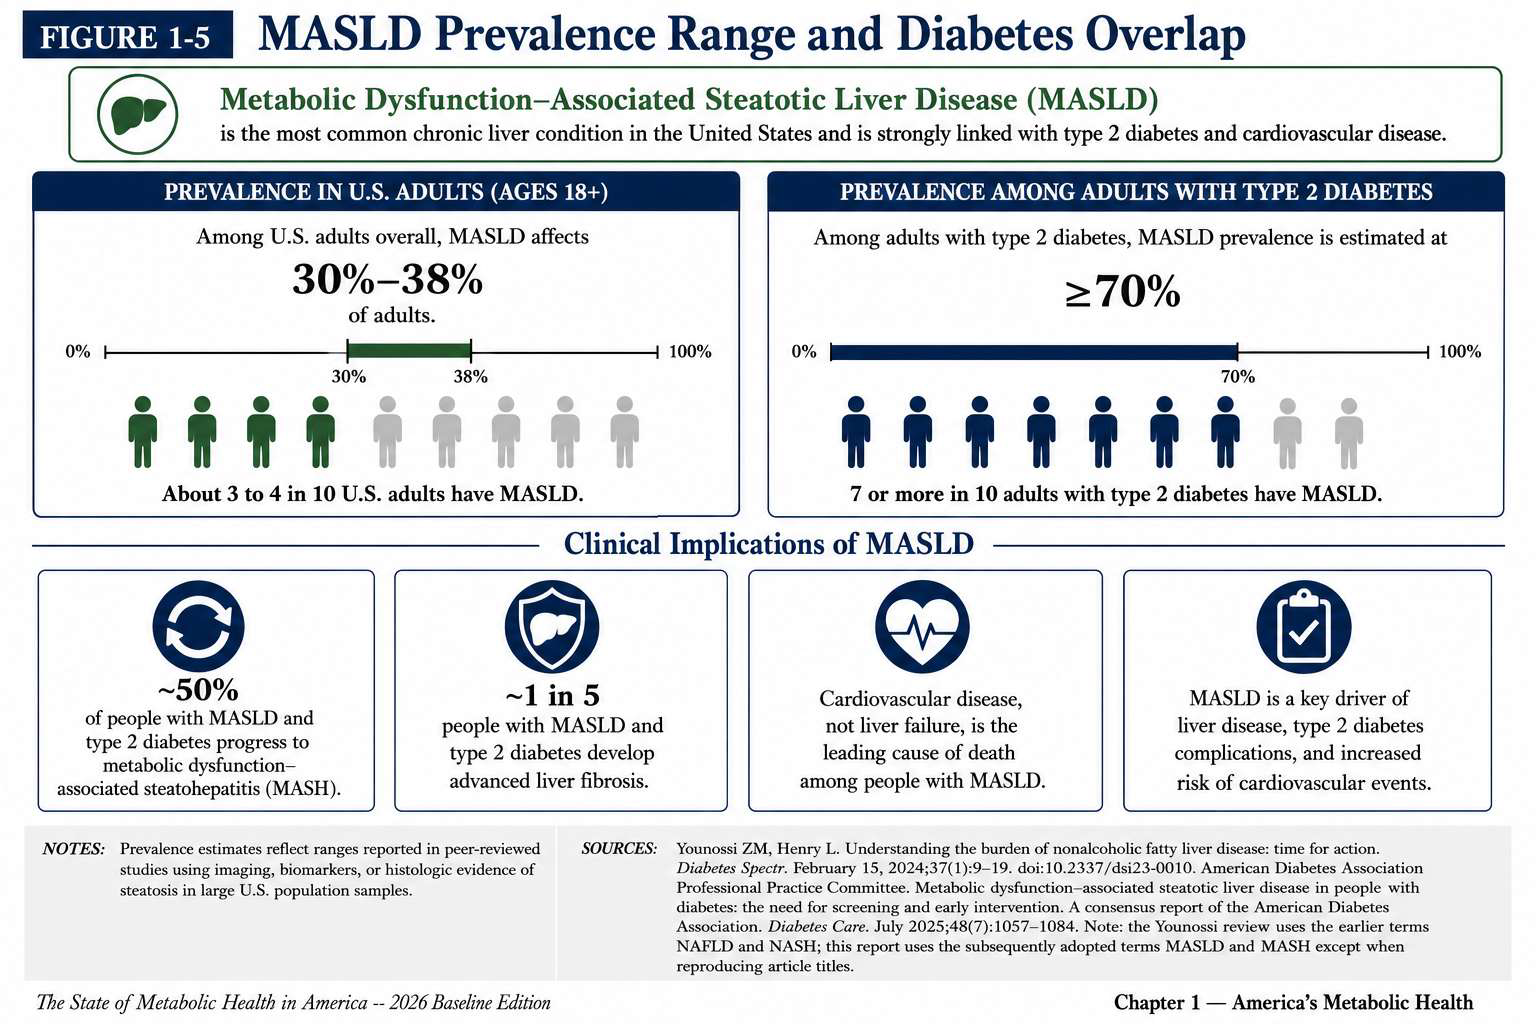
Most adults with chronic kidney disease are unaware of their diagnosis, creating a substantial gap between prevalence and diagnosed cases. Figure 1-5 MASLD Prevalence Range and Diabetes Overlap
Metabolic dysfunction-associated steatotic liver disease prevalence estimates and its overlap with the diabetes population. Figure 1-6 The Sleep Apnea Diagnosis Gap
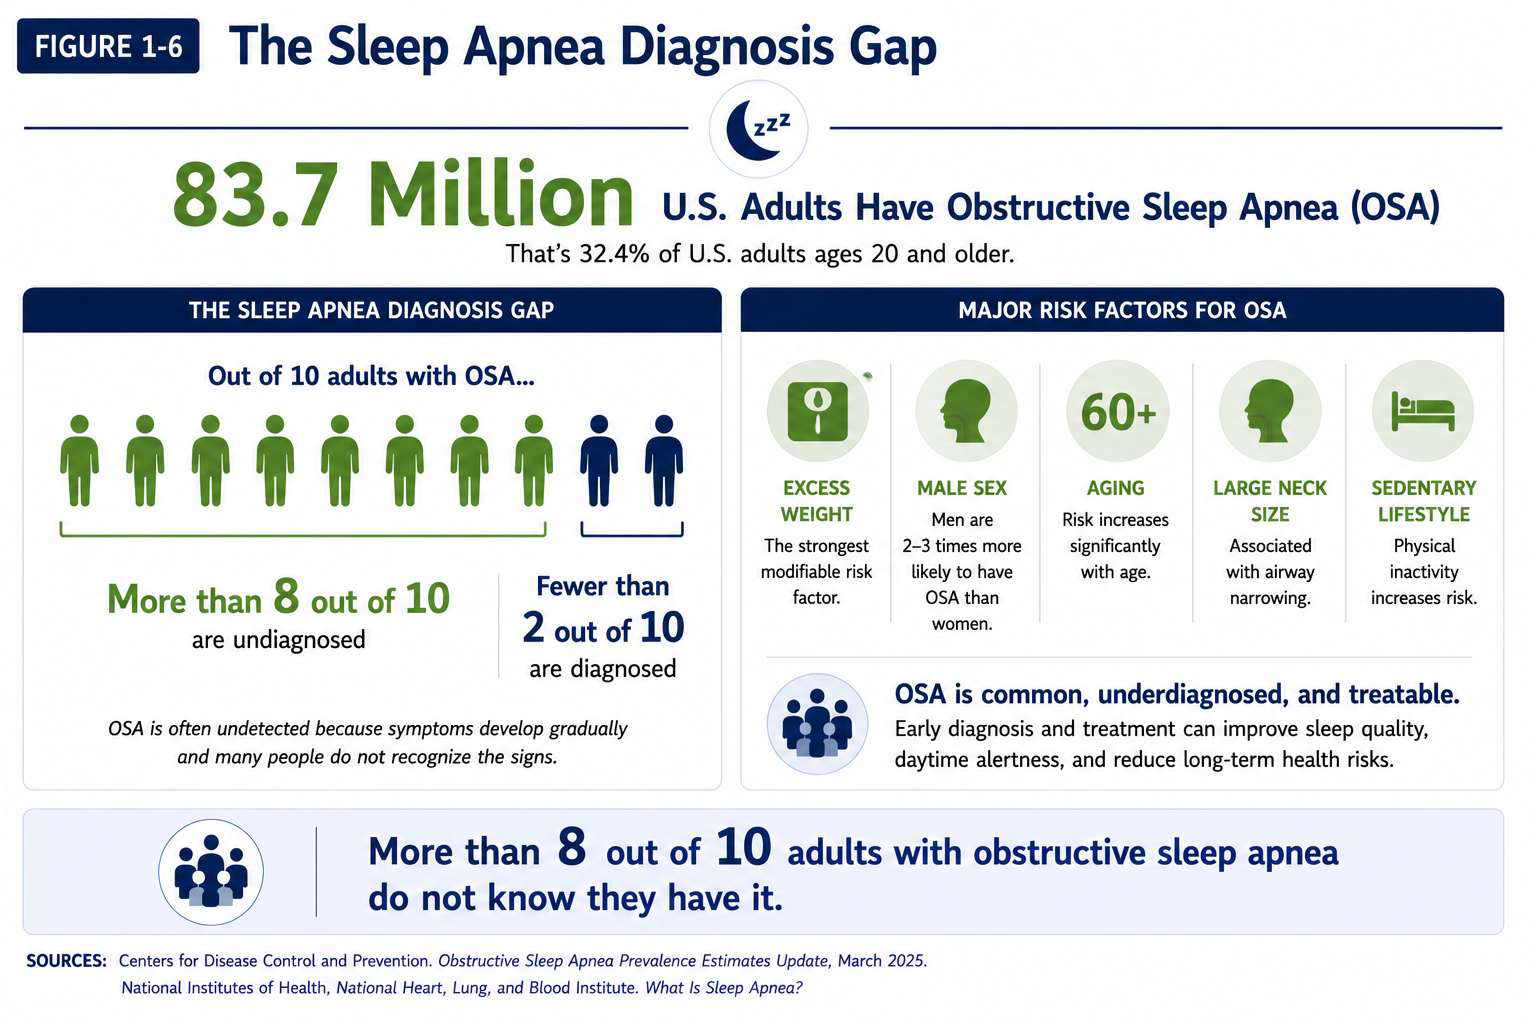
A large share of adults with obstructive sleep apnea remain undiagnosed, limiting treatment and metabolic health management. Figure 1-7 Leading Causes of Death and the CVD Share, 2023
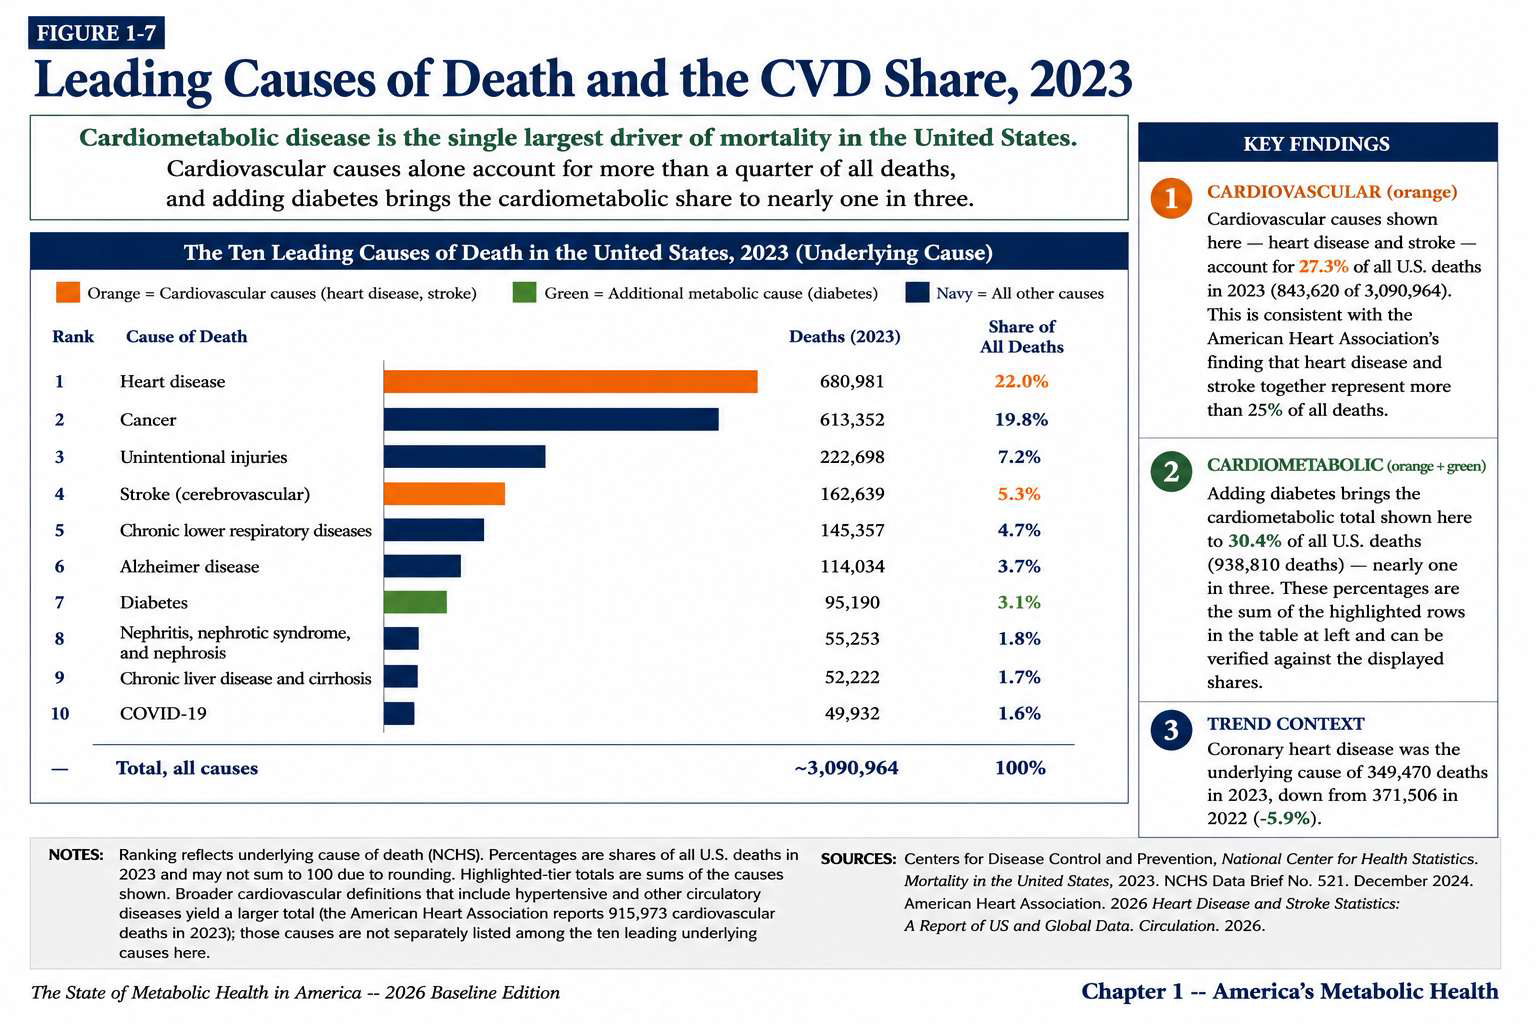
Cardiovascular disease remains the leading cause of death in the United States, accounting for a disproportionate share of total mortality. Figure 1-8 Metabolic Syndrome Prevalence Over Time
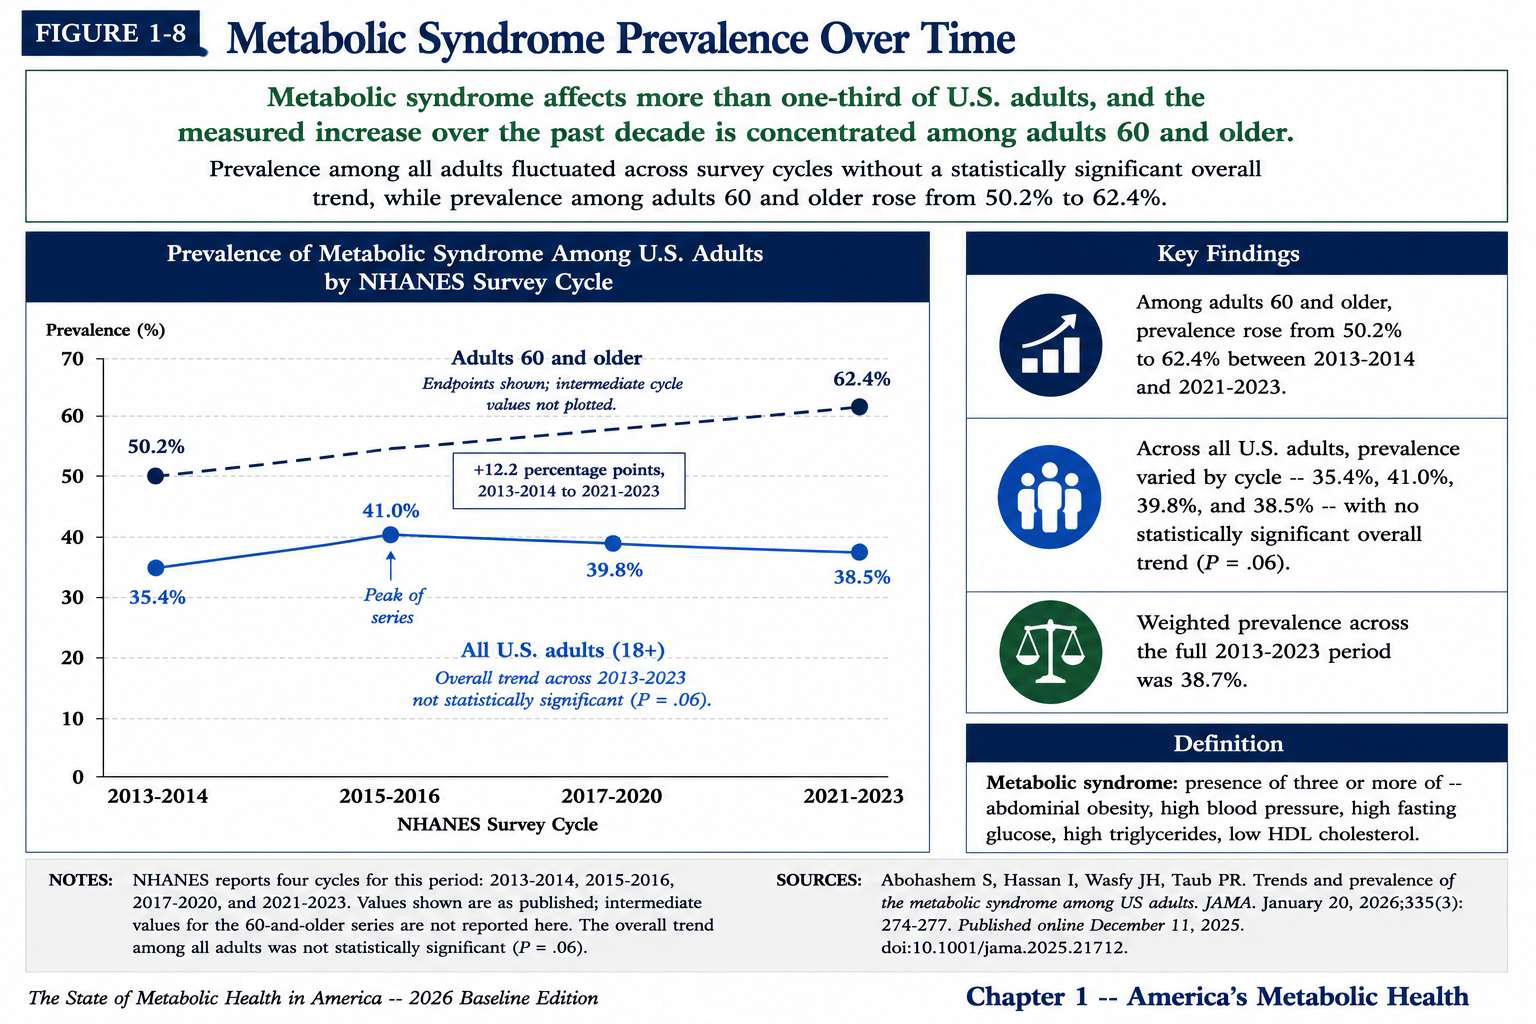
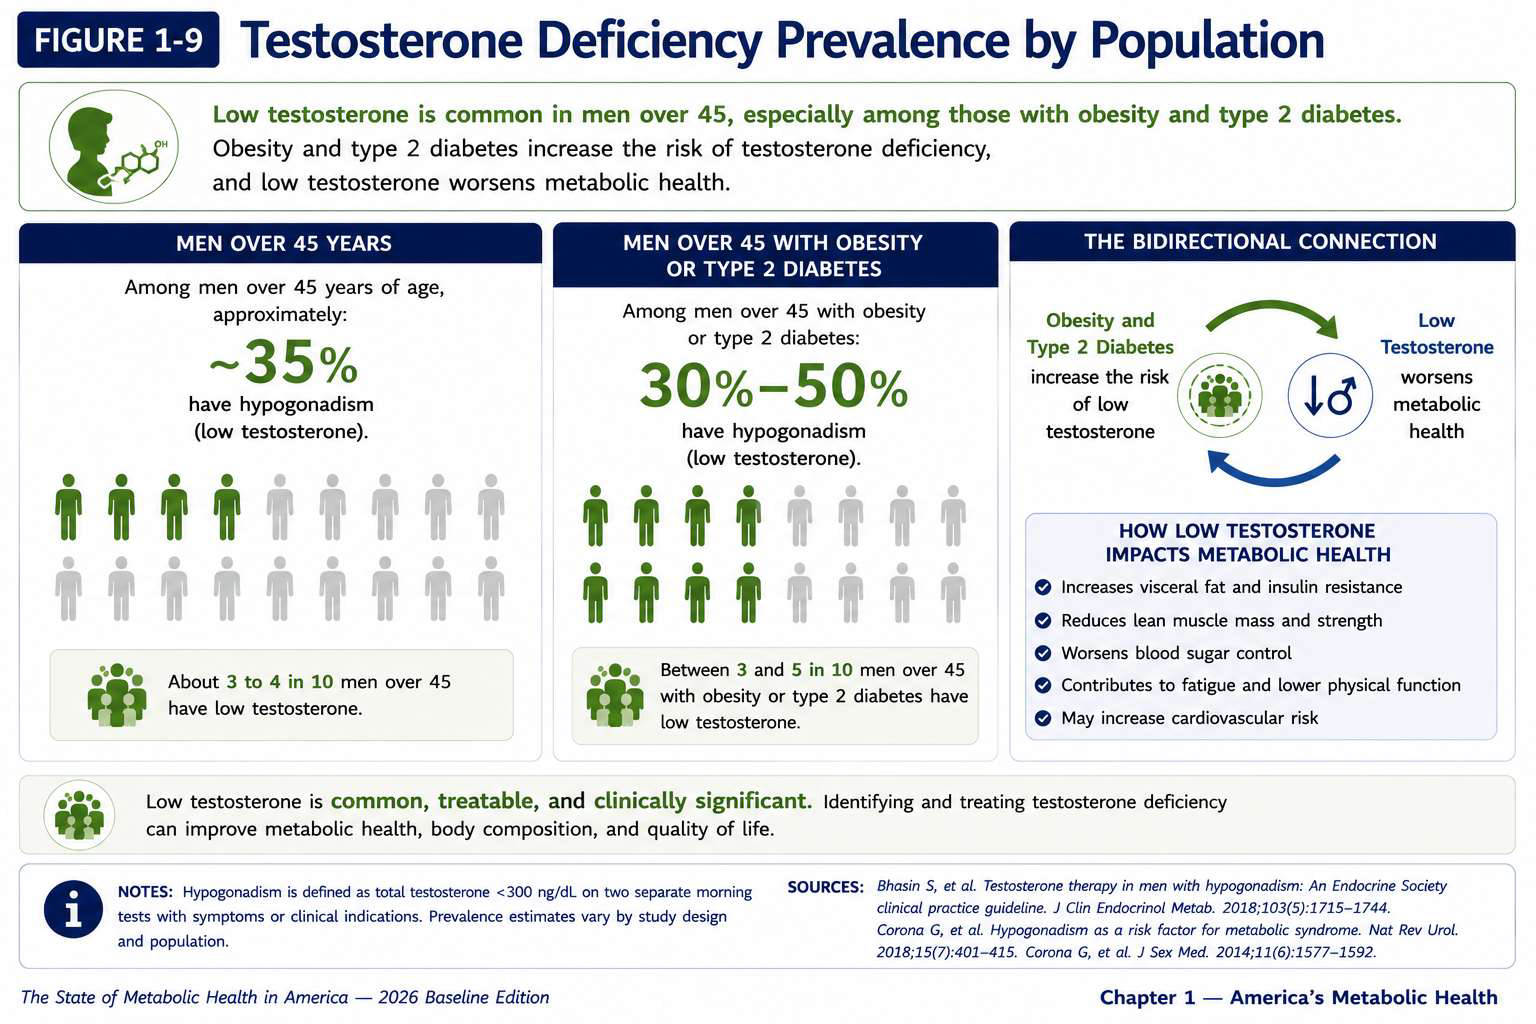
Metabolic syndrome prevalence has increased over successive NHANES survey periods, reflecting worsening cardiometabolic risk across the population. Figure 1-9 Testosterone Deficiency Prevalence by Population
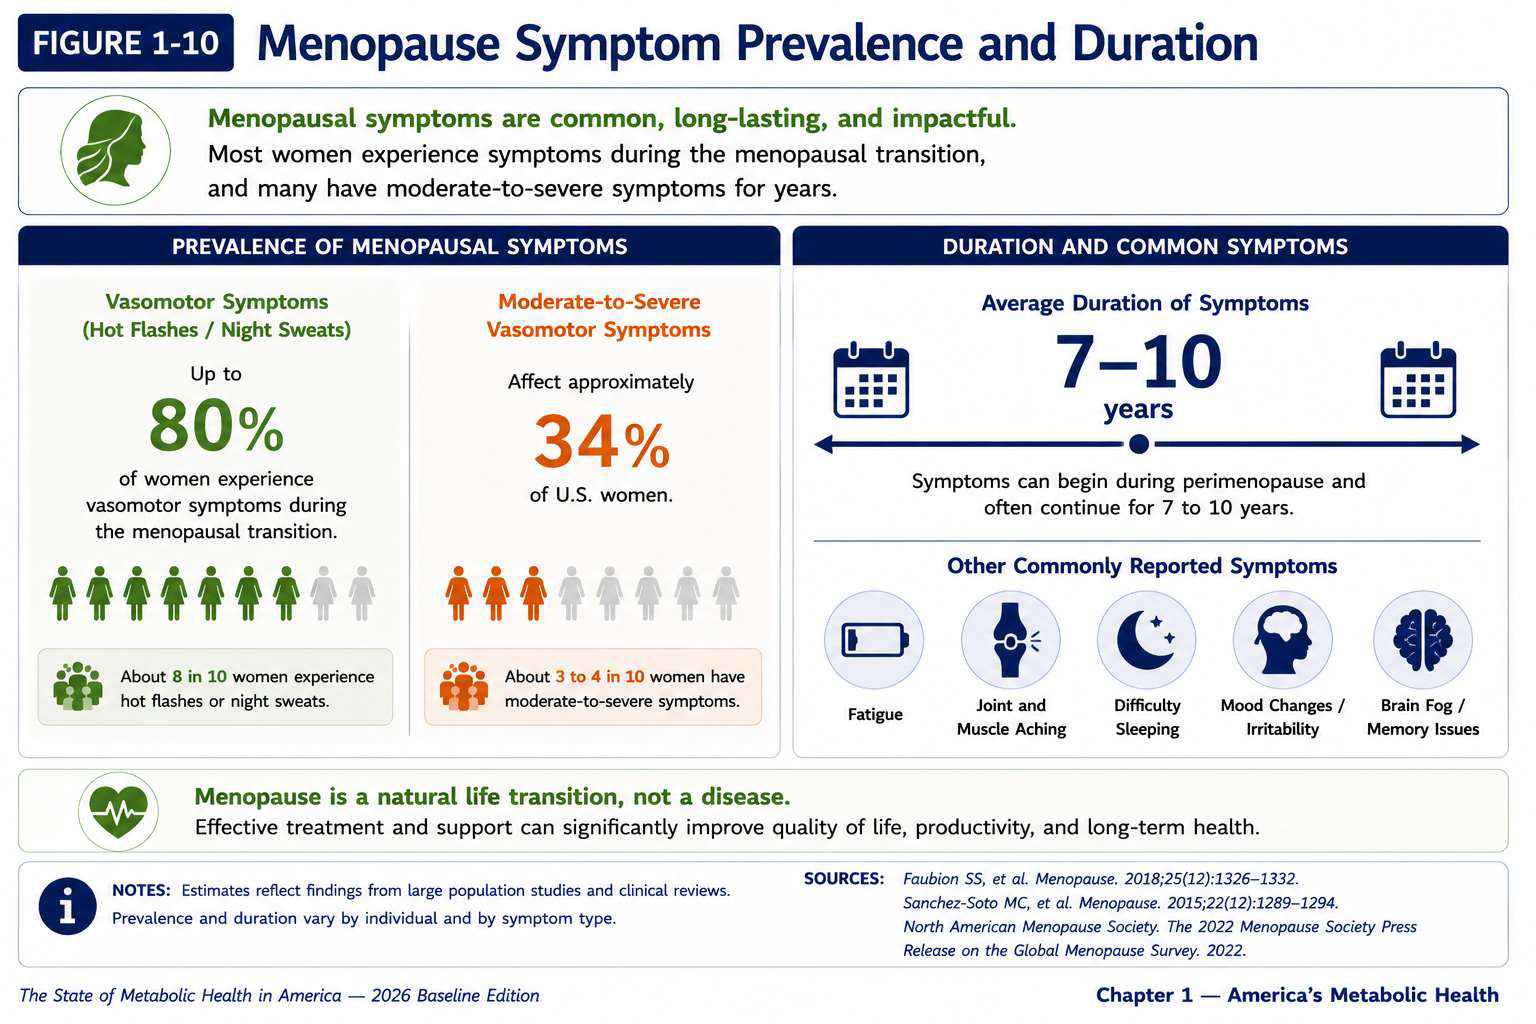
Testosterone deficiency rates vary substantially by population subgroup and are closely linked to metabolic health status. Figure 1-10 Menopause Symptom Prevalence and Duration
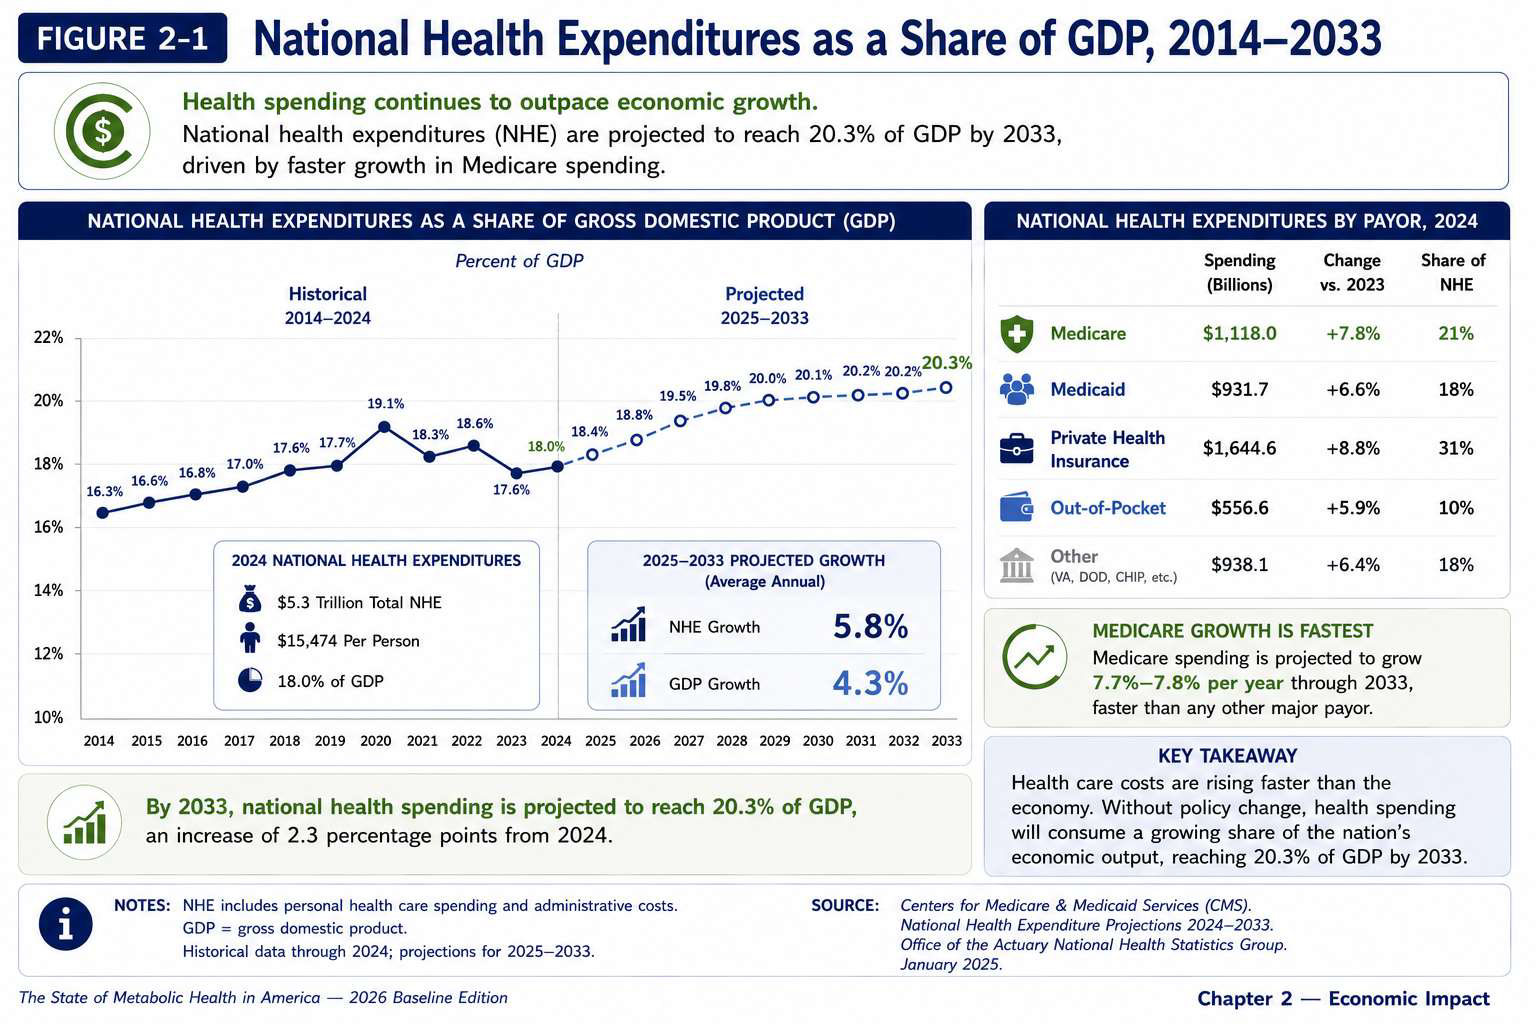
Prevalence and typical duration of menopause-related symptoms, which intersect with metabolic health trajectories in midlife women. Chapter 2 — The Economic Burden Figure 2-1 National Health Expenditures as a Share of GDP, 2014–2033
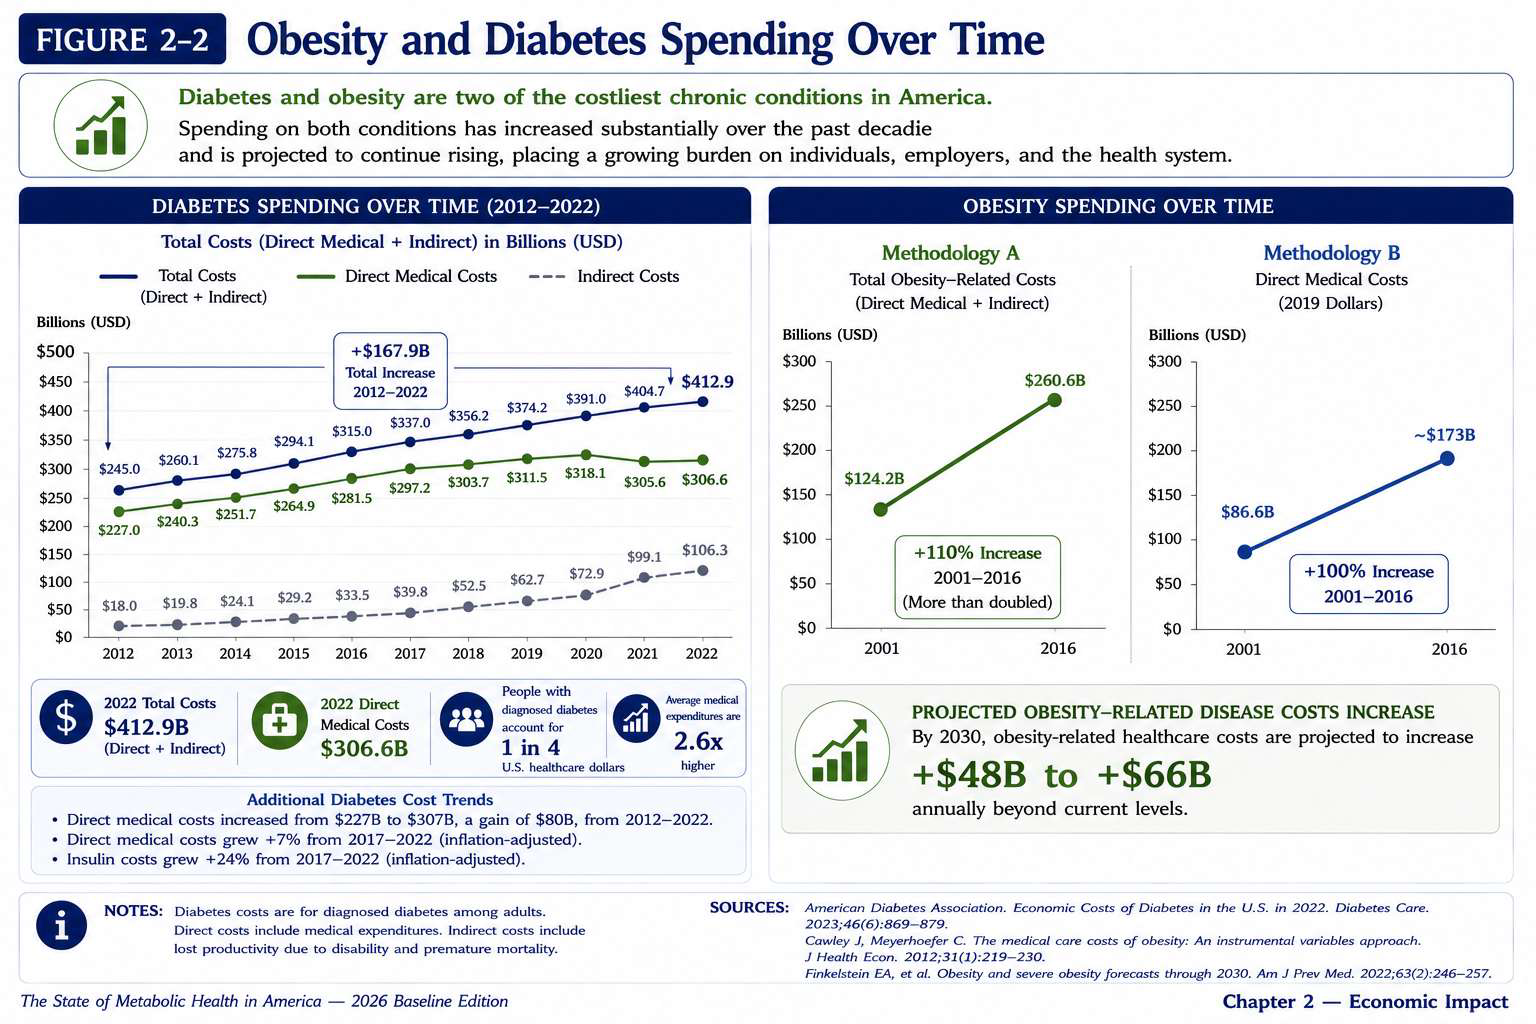
U.S. health spending as a percentage of GDP, with projections through 2033 showing continued growth driven in part by metabolic disease. Figure 2-2 Obesity and Diabetes Spending Over Time
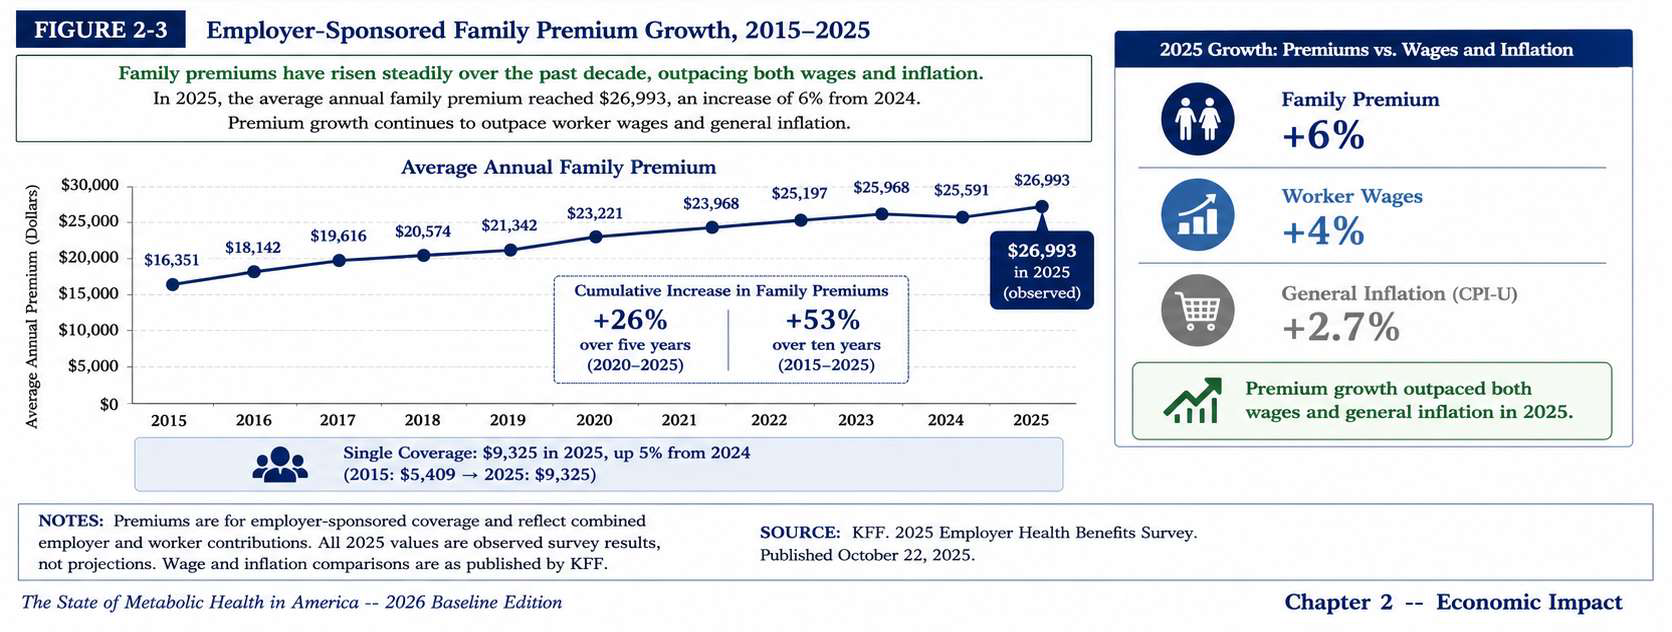
Direct medical spending attributable to obesity and diabetes has grown substantially, outpacing overall health expenditure growth. Figure 2-3 Employer-Sponsored Family Premium Growth, 2015–2025
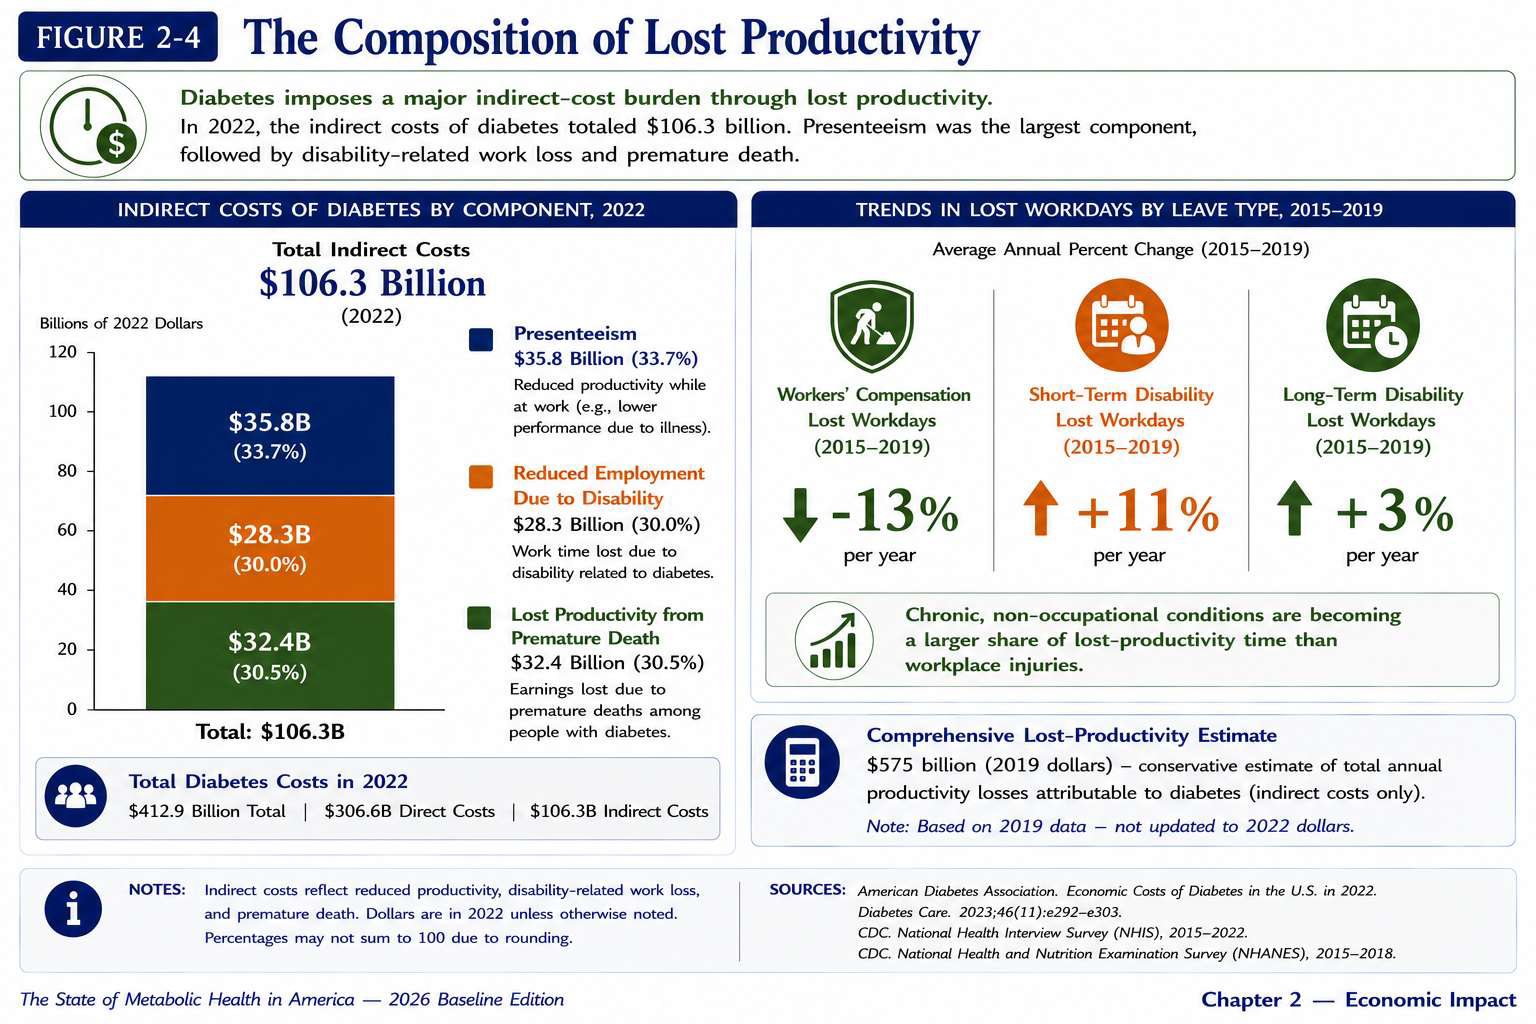
Employer-sponsored family health insurance premiums have grown significantly over the past decade, driven partly by metabolic disease costs. Figure 2-4 The Composition of Lost Productivity
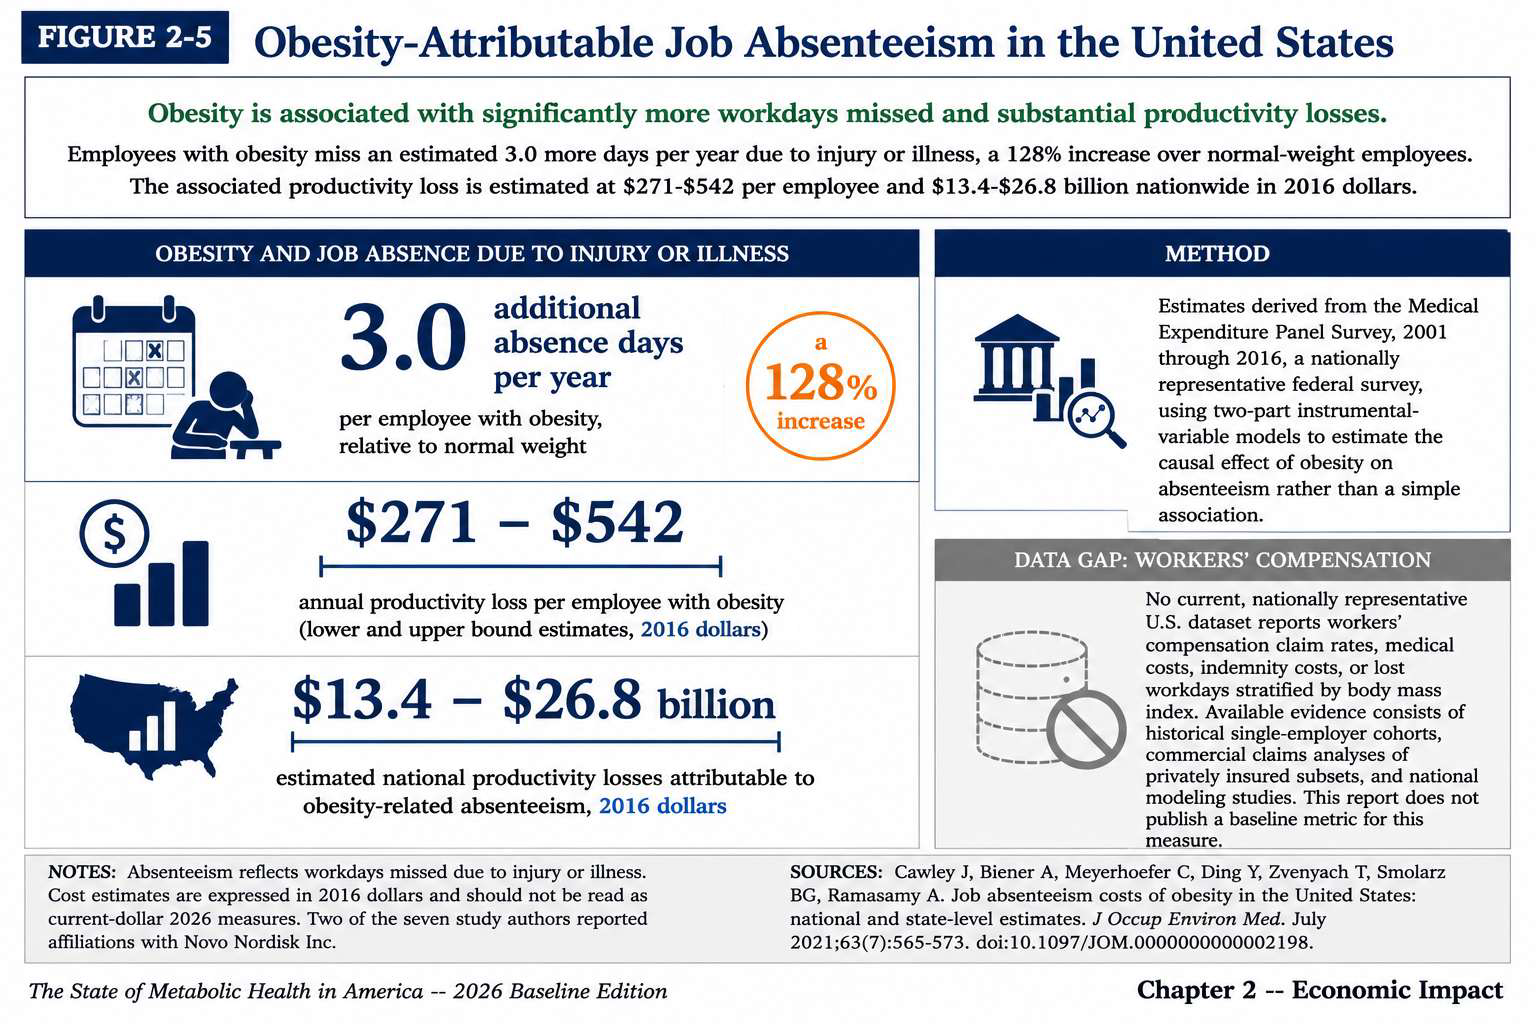
Breakdown of productivity losses attributable to poor metabolic health, including absenteeism, presenteeism, and disability. Figure 2-5 Obesity-Attributable Job Absenteeism in the United States
Estimated days of work lost annually due to obesity-related illness, representing a significant but often overlooked employer cost. Figure 2-6 International Evidence on Metabolic Health and Disability Pension Risk
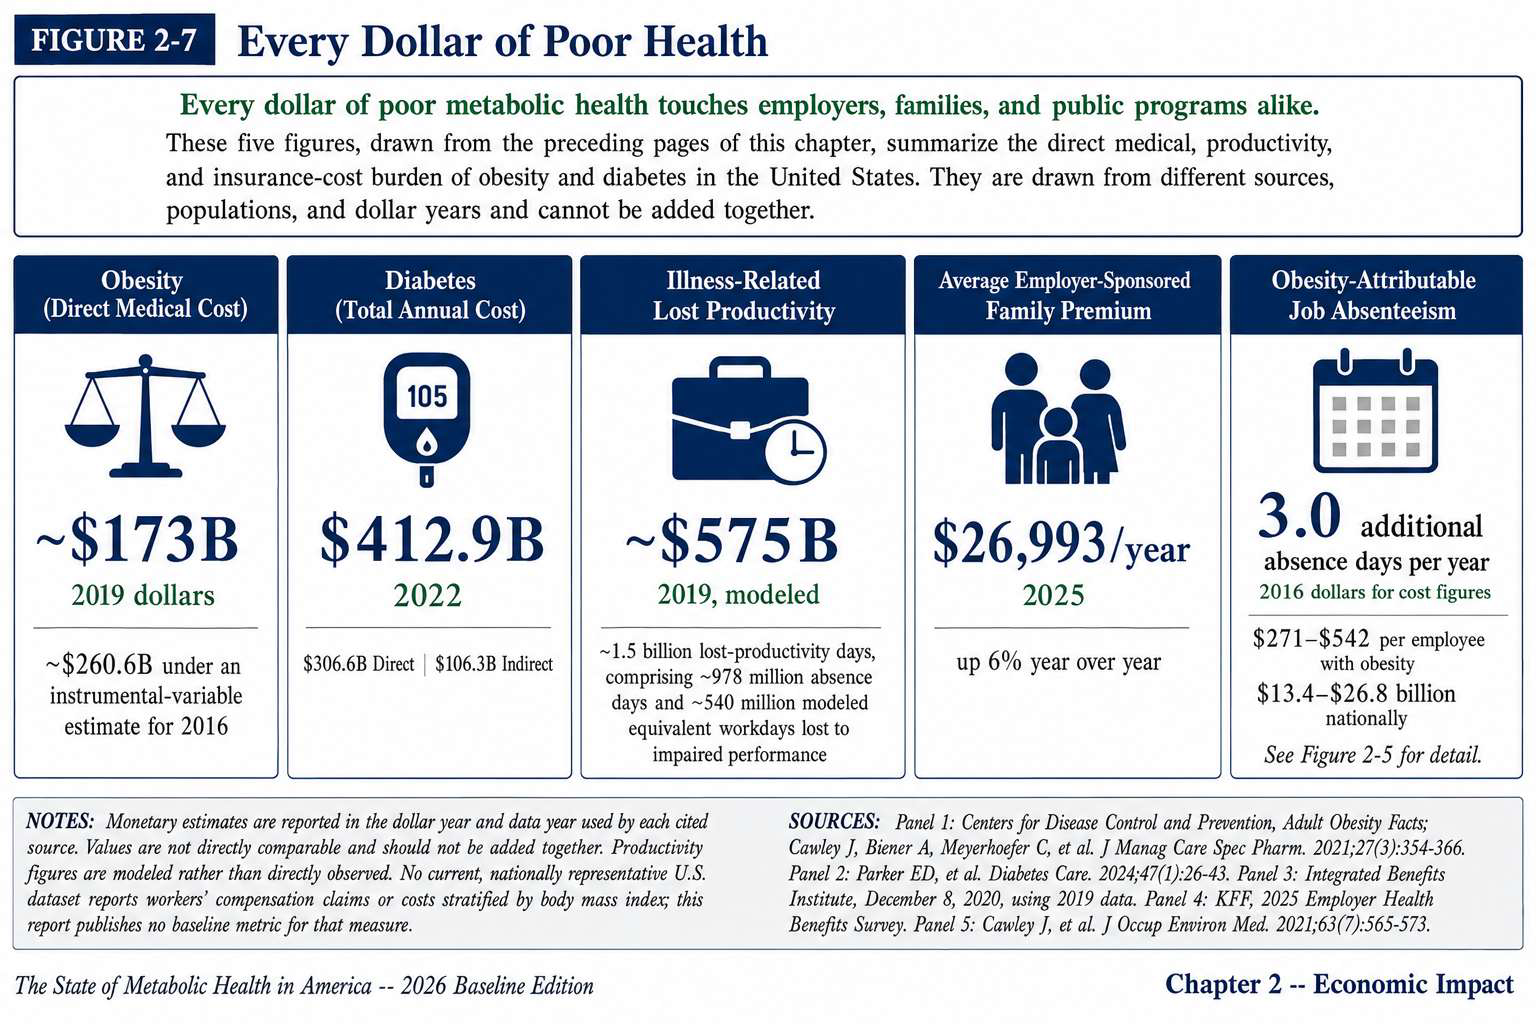
Cross-national evidence linking poor metabolic health to elevated disability pension risk, with implications for workforce participation. Figure 2-7 Every Dollar of Poor Health
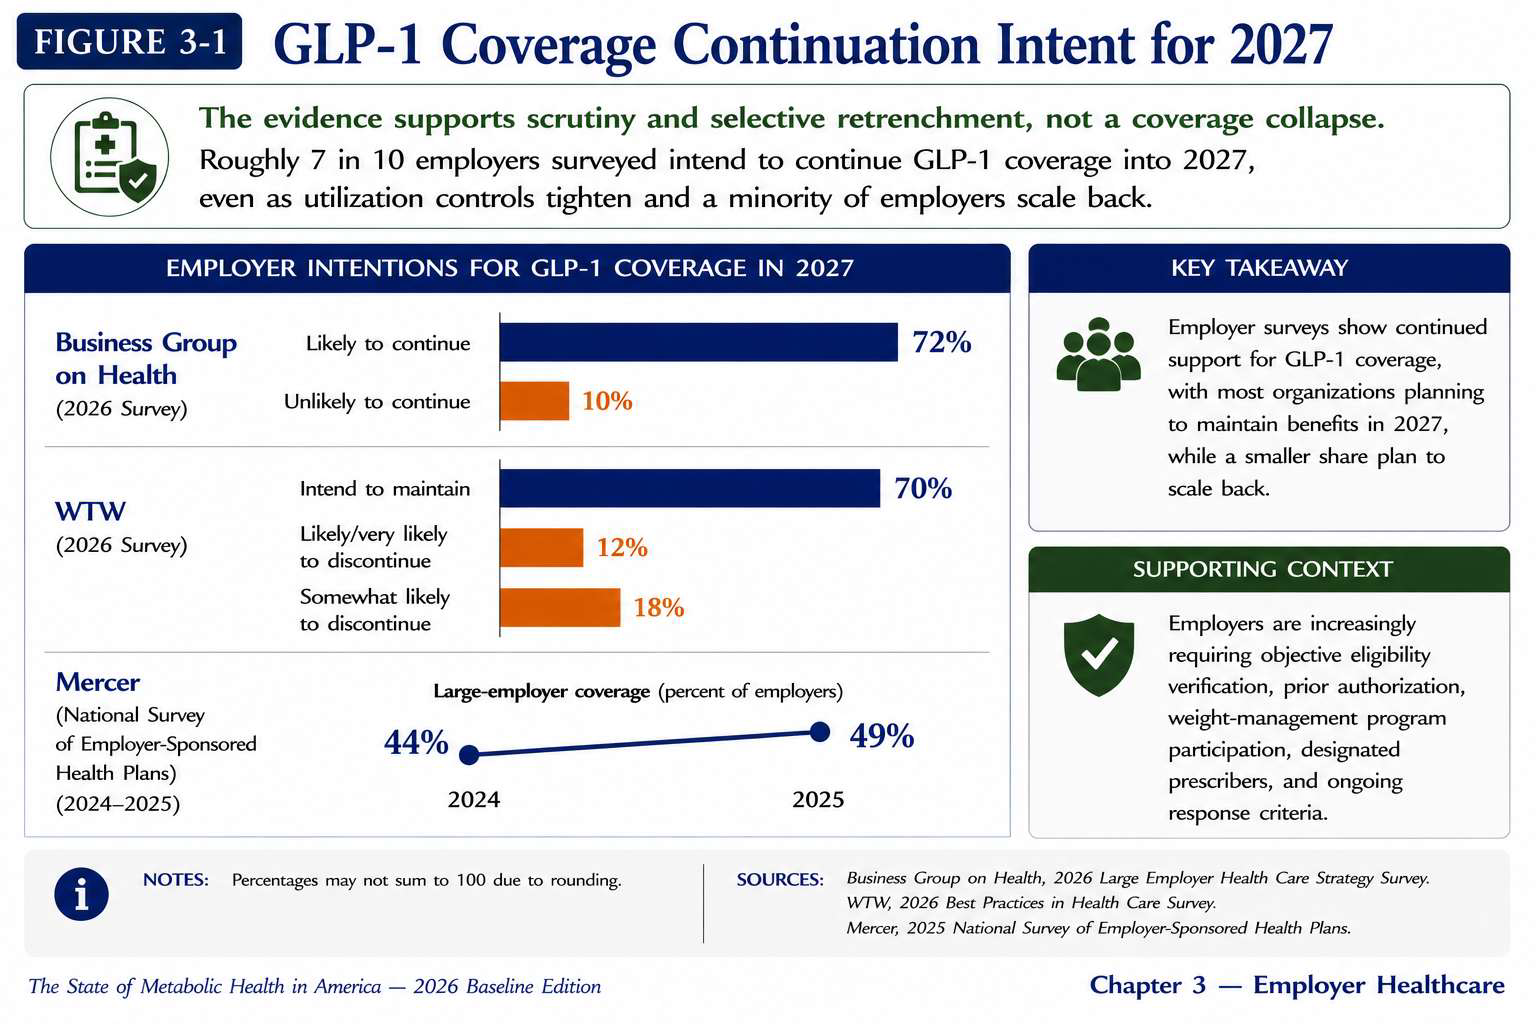
A comprehensive accounting of the full economic cost of poor metabolic health, spanning direct medical, productivity, and societal costs. Chapter 3 — Employer Health Benefits Figure 3-1 GLP-1 Coverage Continuation Intent for 2027
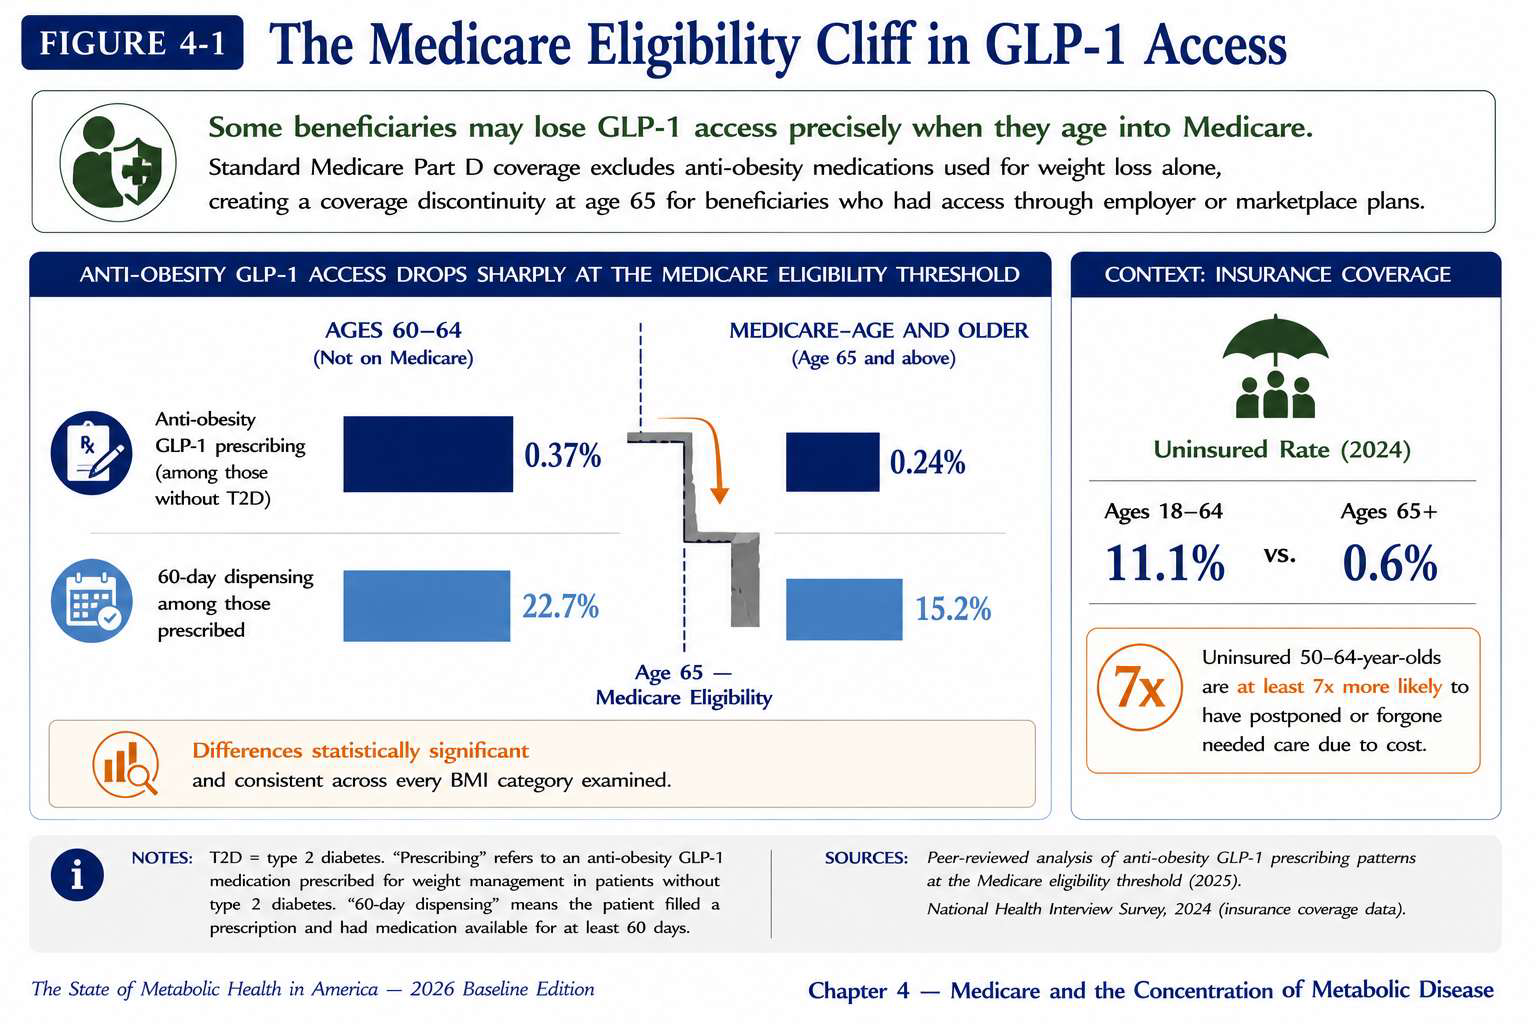
Survey of employer plan sponsors on their intent to continue or expand GLP-1 medication coverage in 2027 benefit designs. Chapter 4 — Medicare Figure 4-1 The Medicare Eligibility Cliff in GLP-1 Access
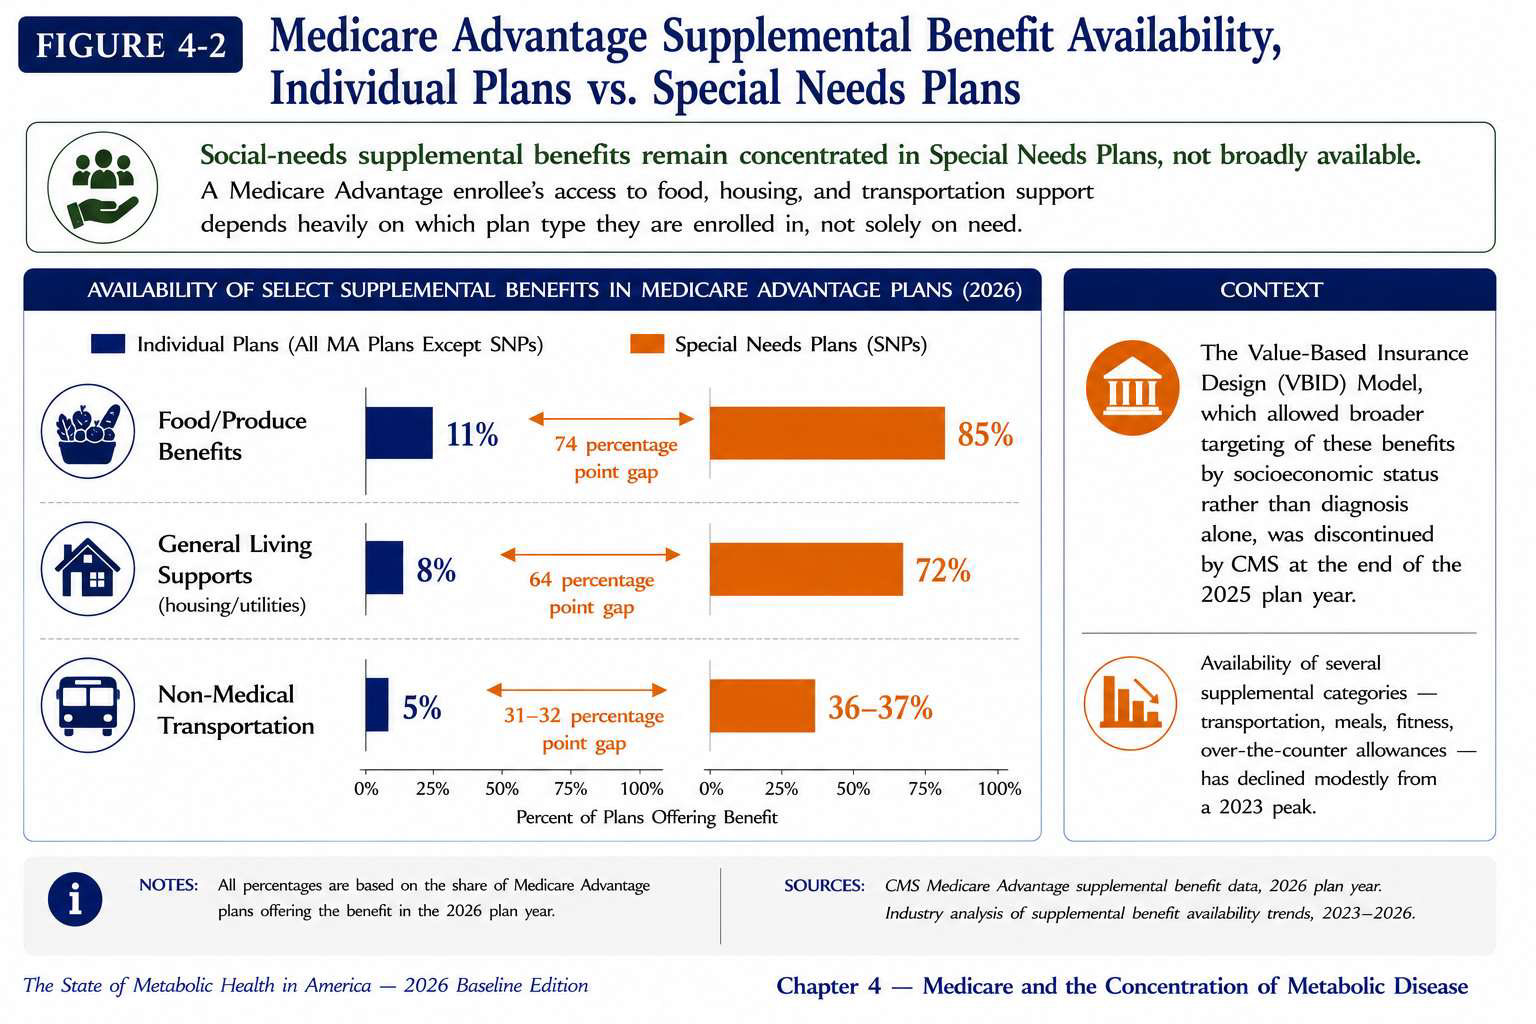
The transition to Medicare creates an abrupt change in GLP-1 coverage access for many beneficiaries, creating a coverage cliff. Figure 4-2 Medicare Advantage Supplemental Benefit Availability, Individual Plans vs. Special Needs Plans
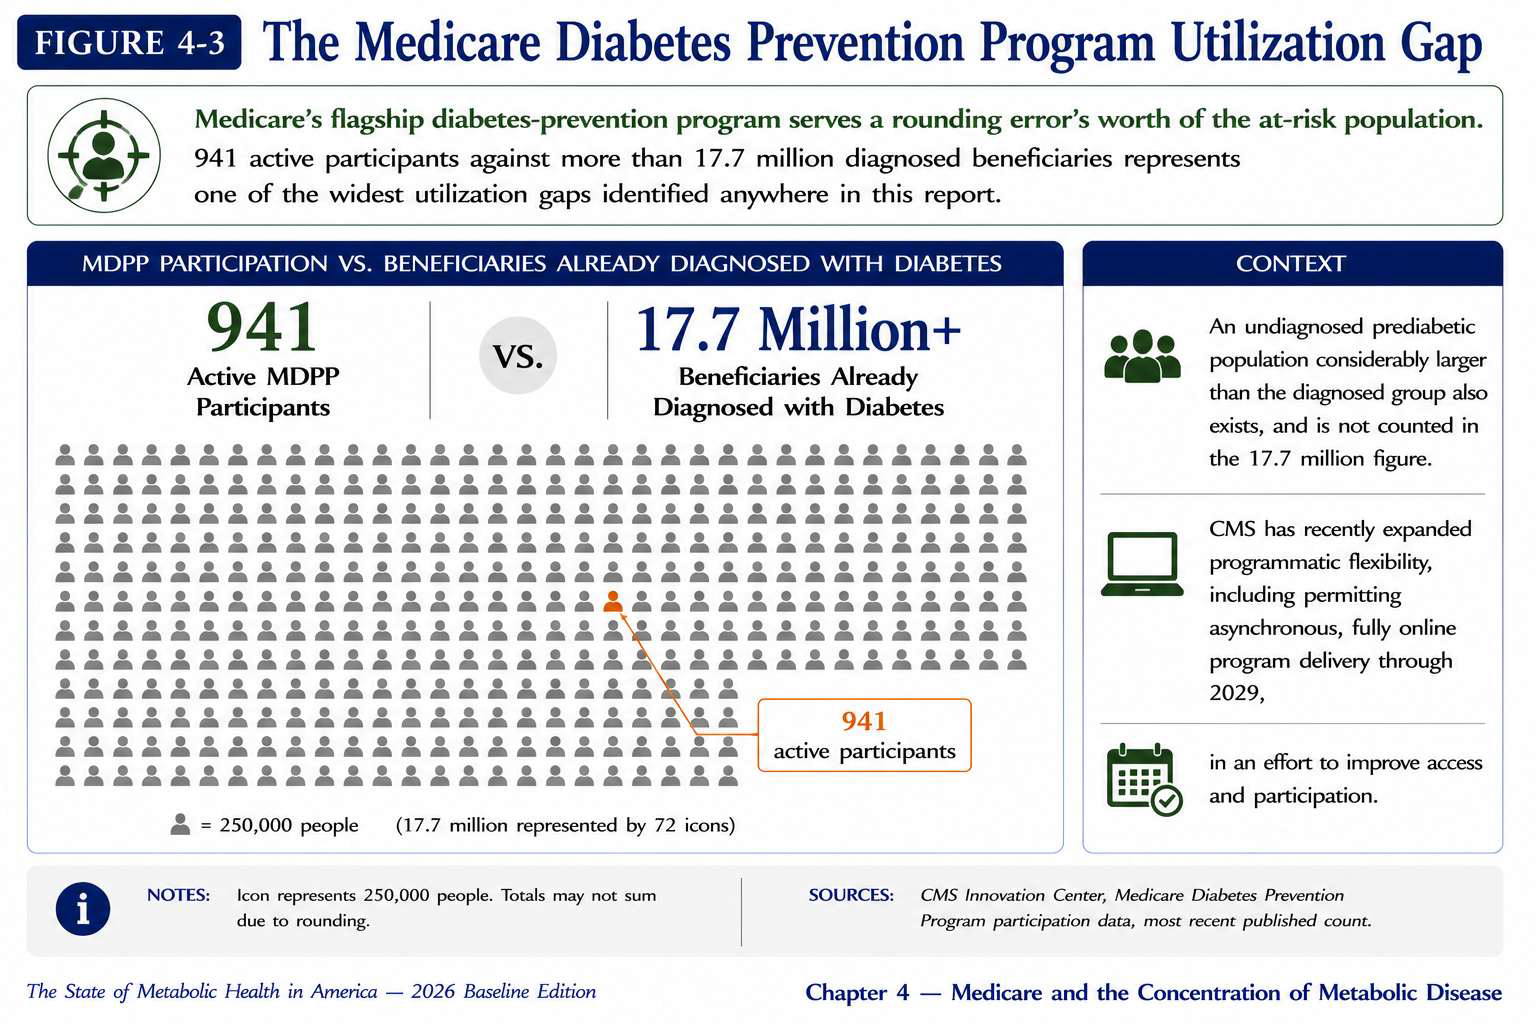
Comparison of supplemental benefit availability in standard Medicare Advantage plans versus Special Needs Plans for metabolic health services. Figure 4-3 The Medicare Diabetes Prevention Program Utilization Gap
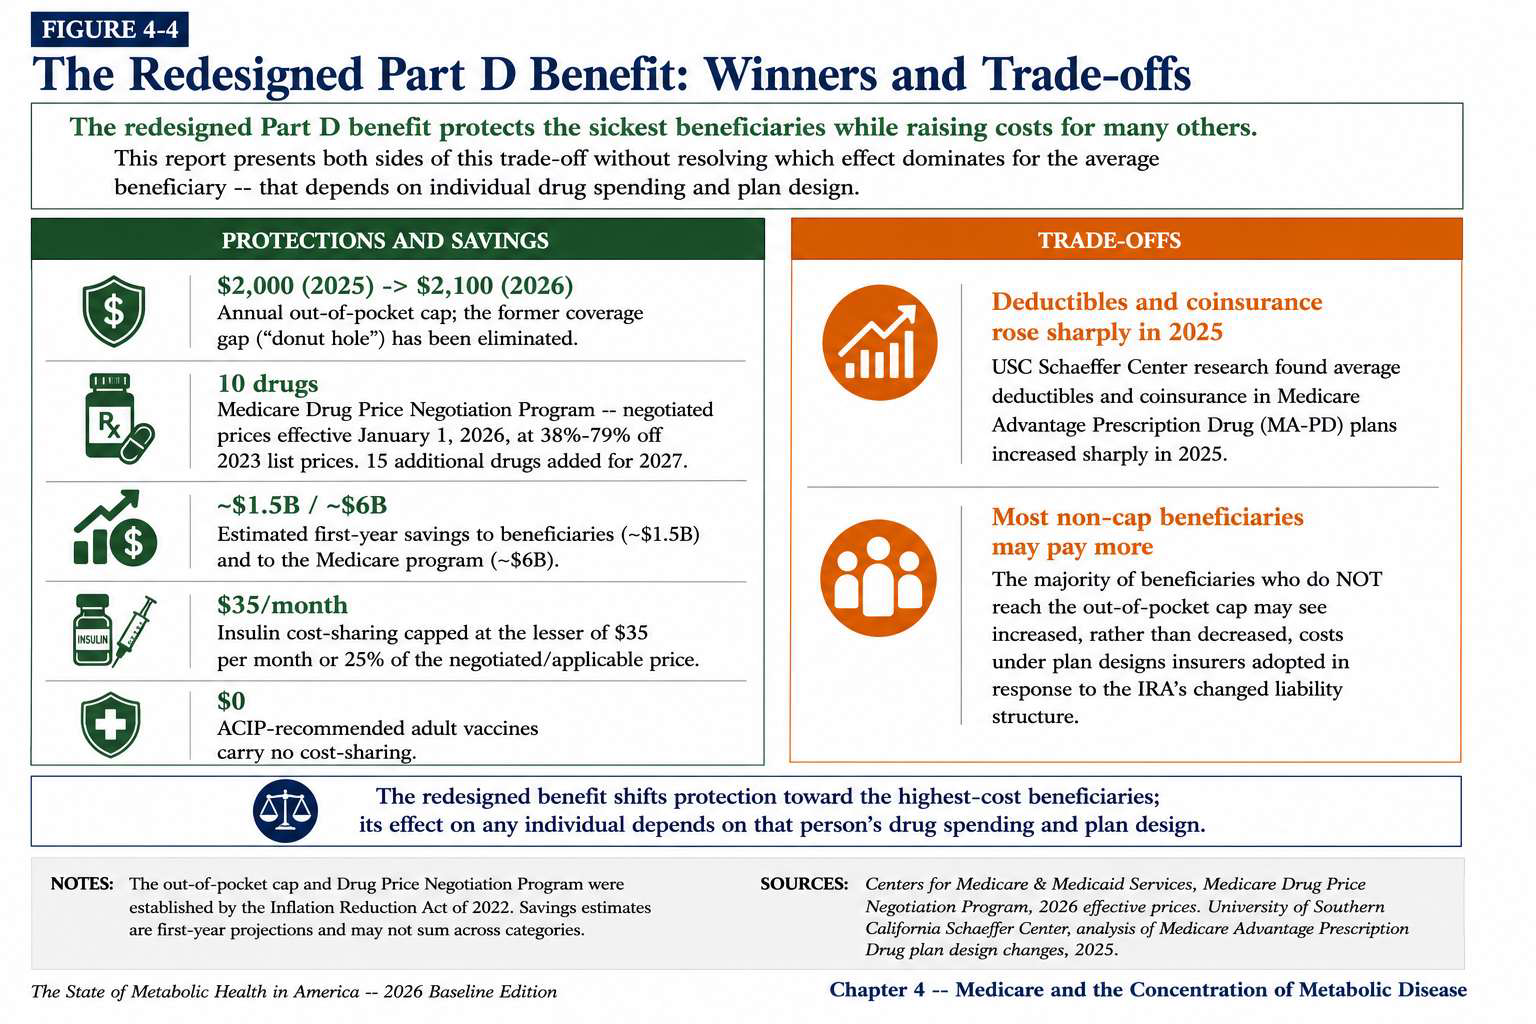
Despite broad eligibility, utilization of the Medicare Diabetes Prevention Program remains far below its potential reach. Figure 4-4 The Redesigned Part D Benefit: Winners and Trade-offs
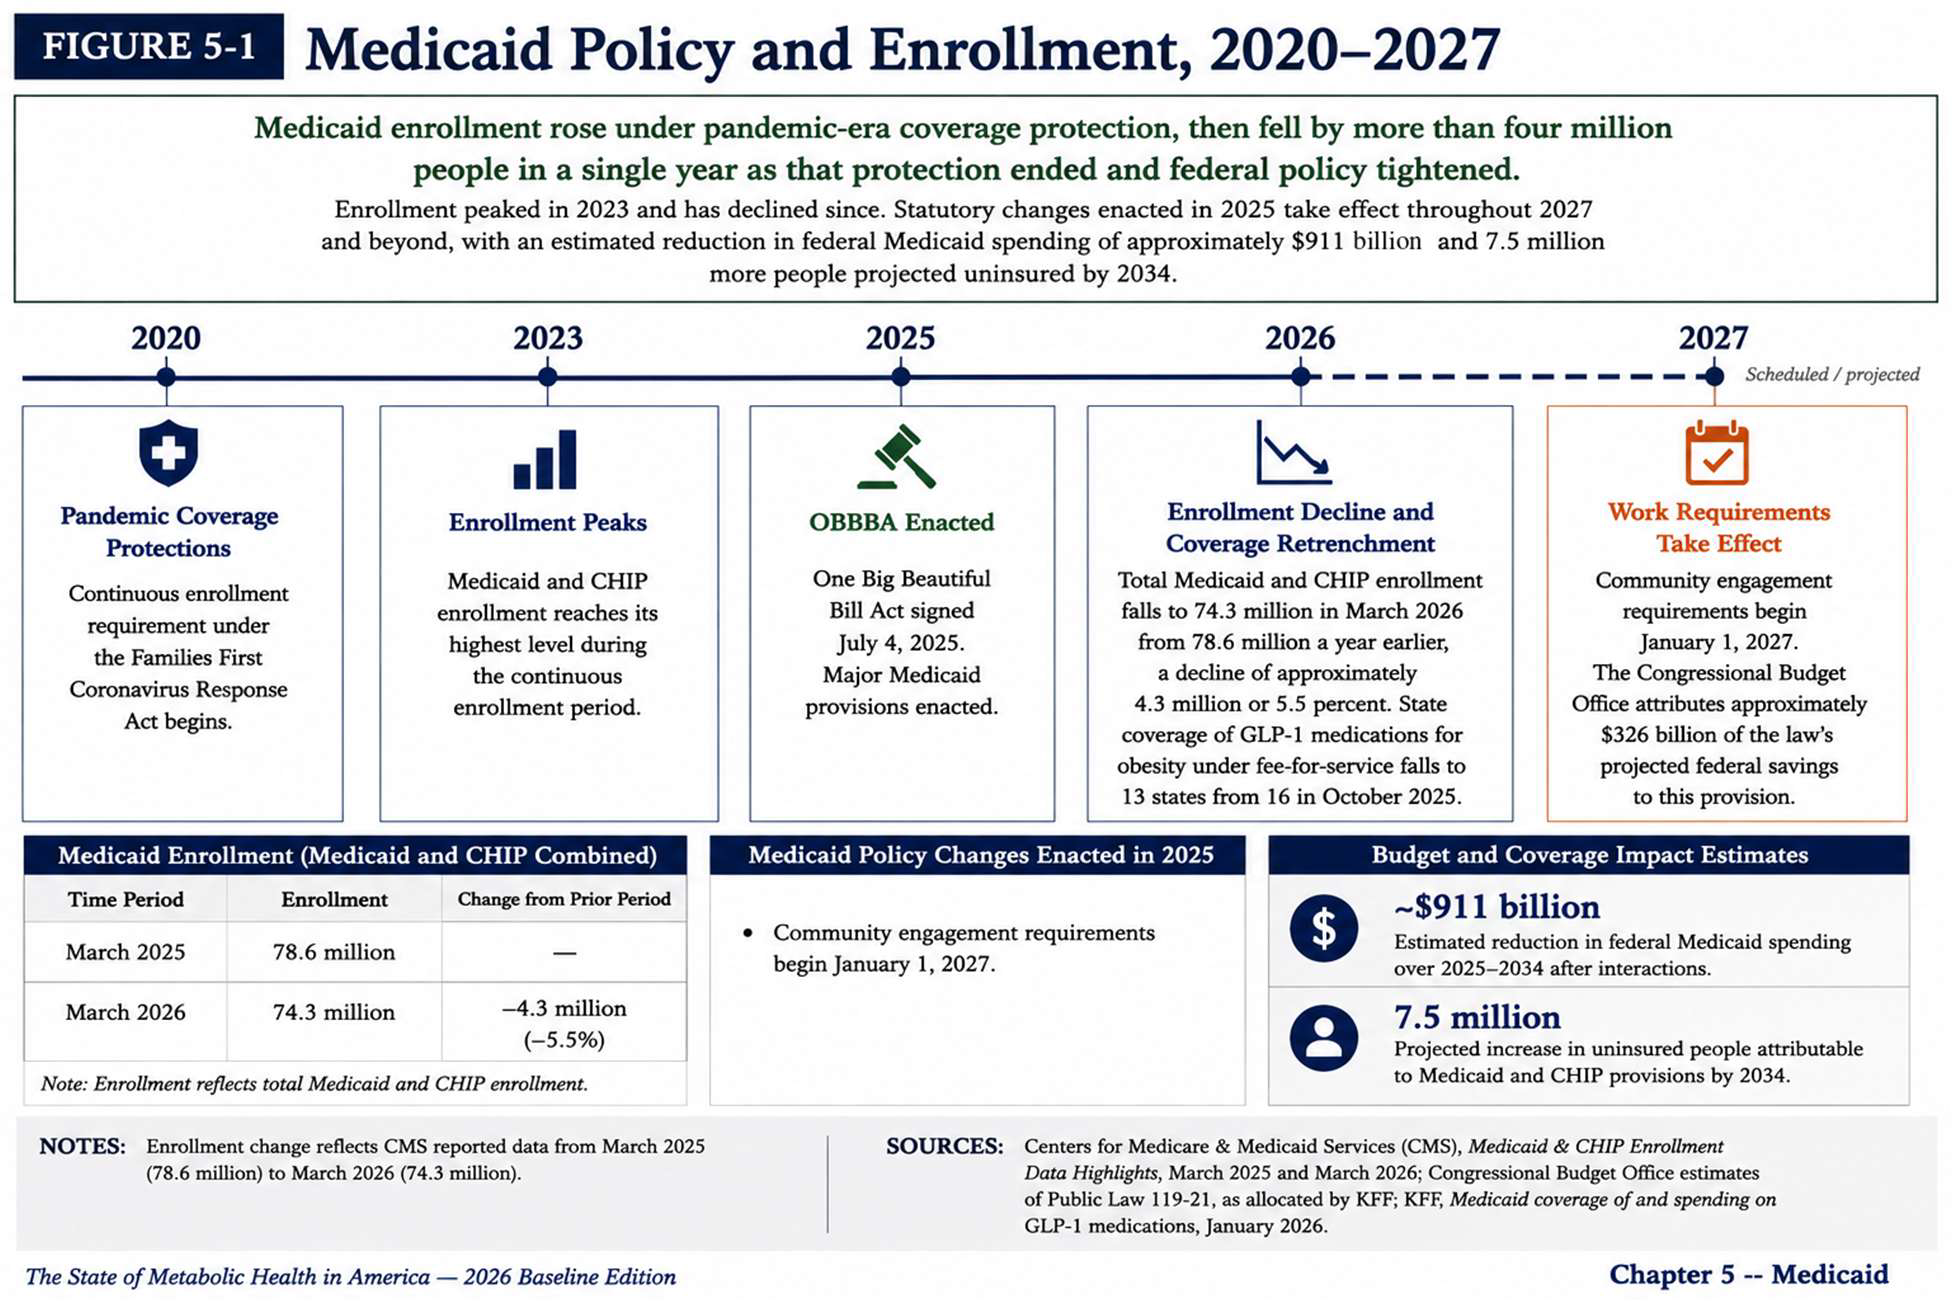
Analysis of the restructured Medicare Part D benefit design and its differential effects on beneficiaries with metabolic conditions. Chapter 5 — Medicaid Figure 5-1 Medicaid Policy and Enrollment, 2020–2027
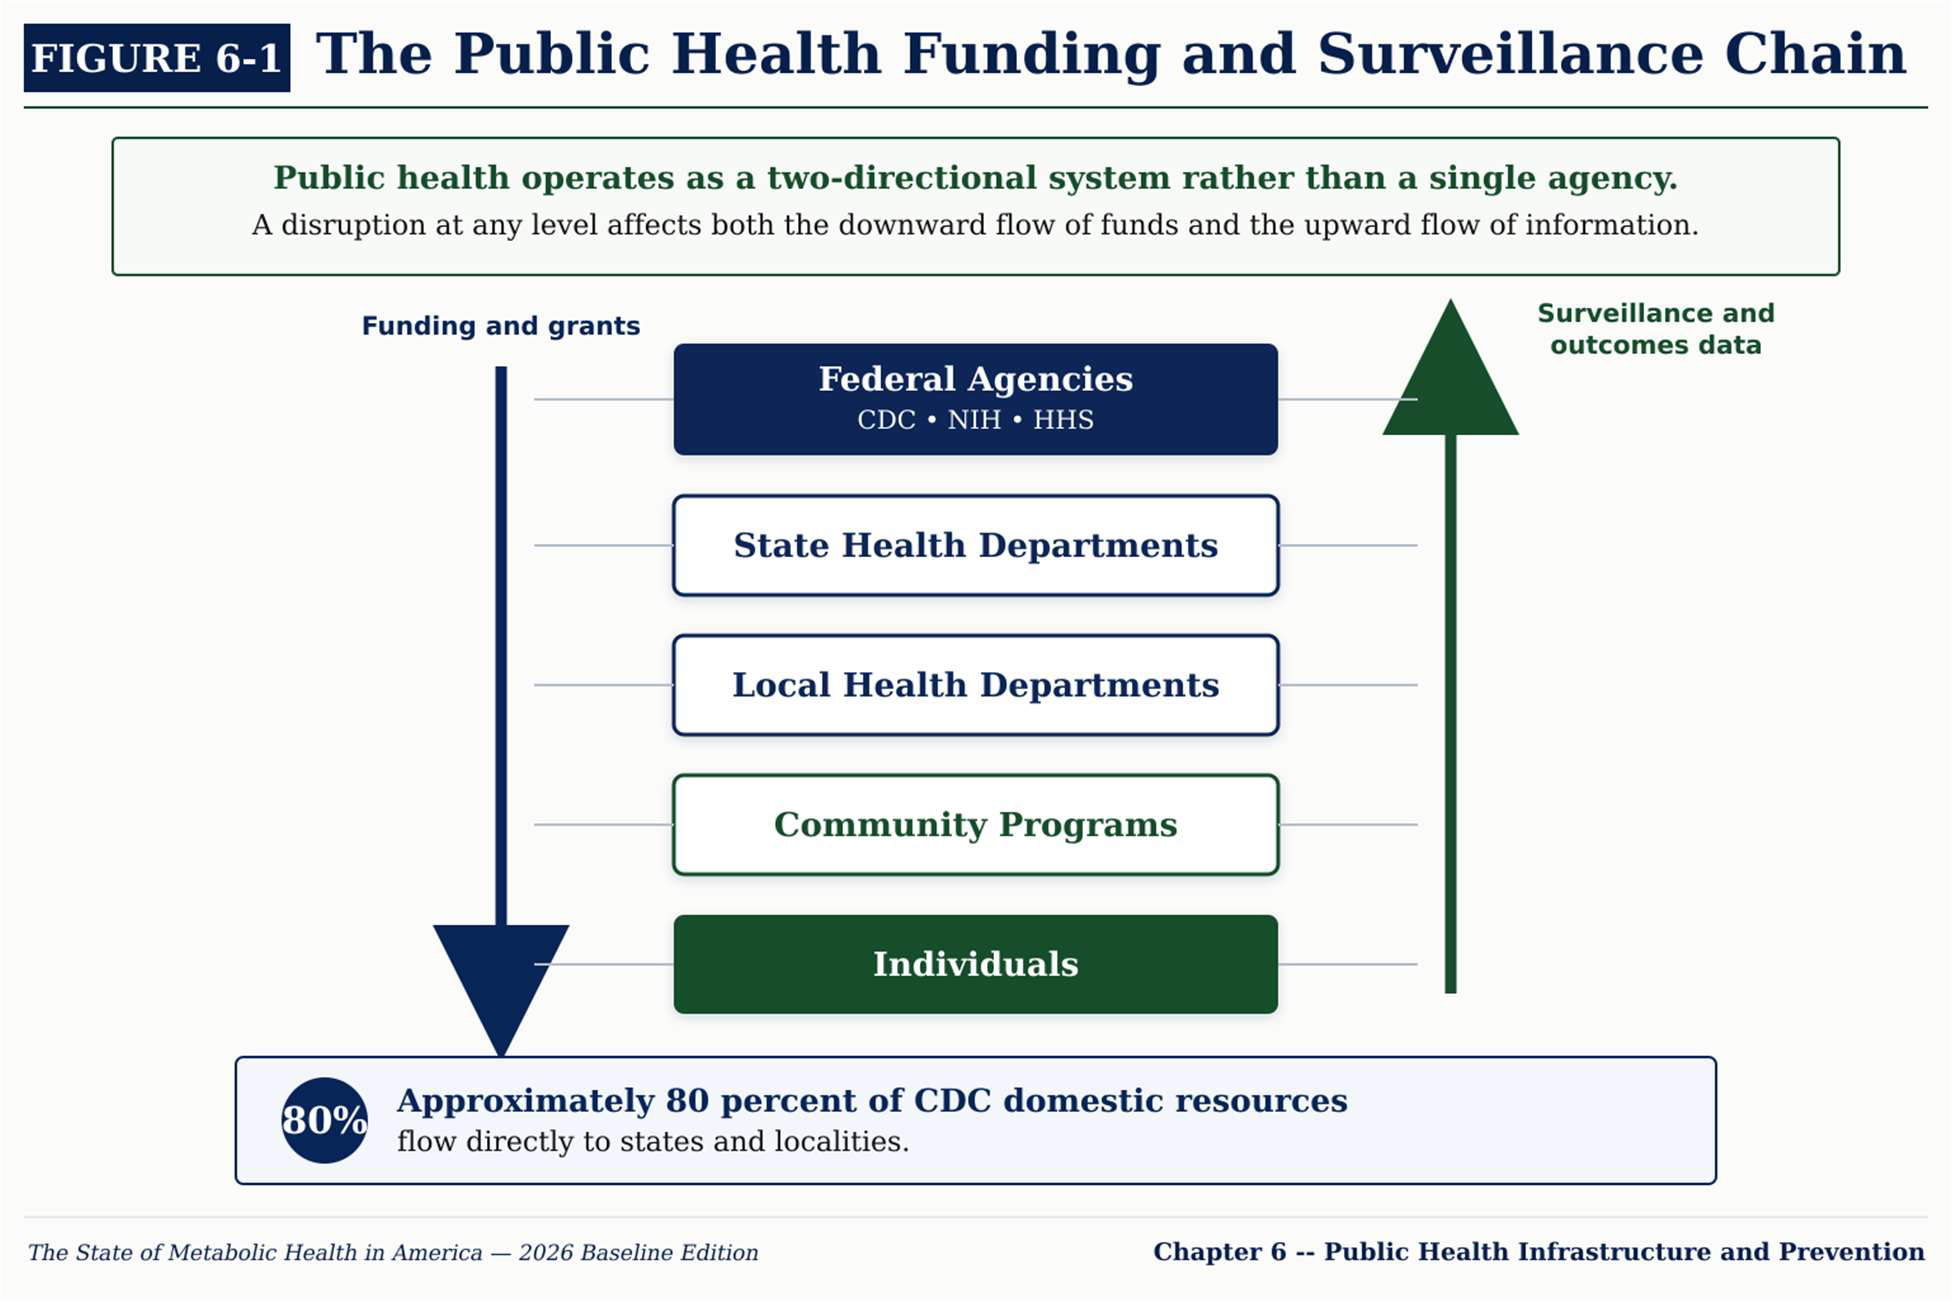
Medicaid enrollment trends and key policy changes from 2020 through 2027, including the unwinding of continuous enrollment protections. Chapter 6 — Public Health Infrastructure Figure 6-1 The Public Health Funding and Surveillance Chain
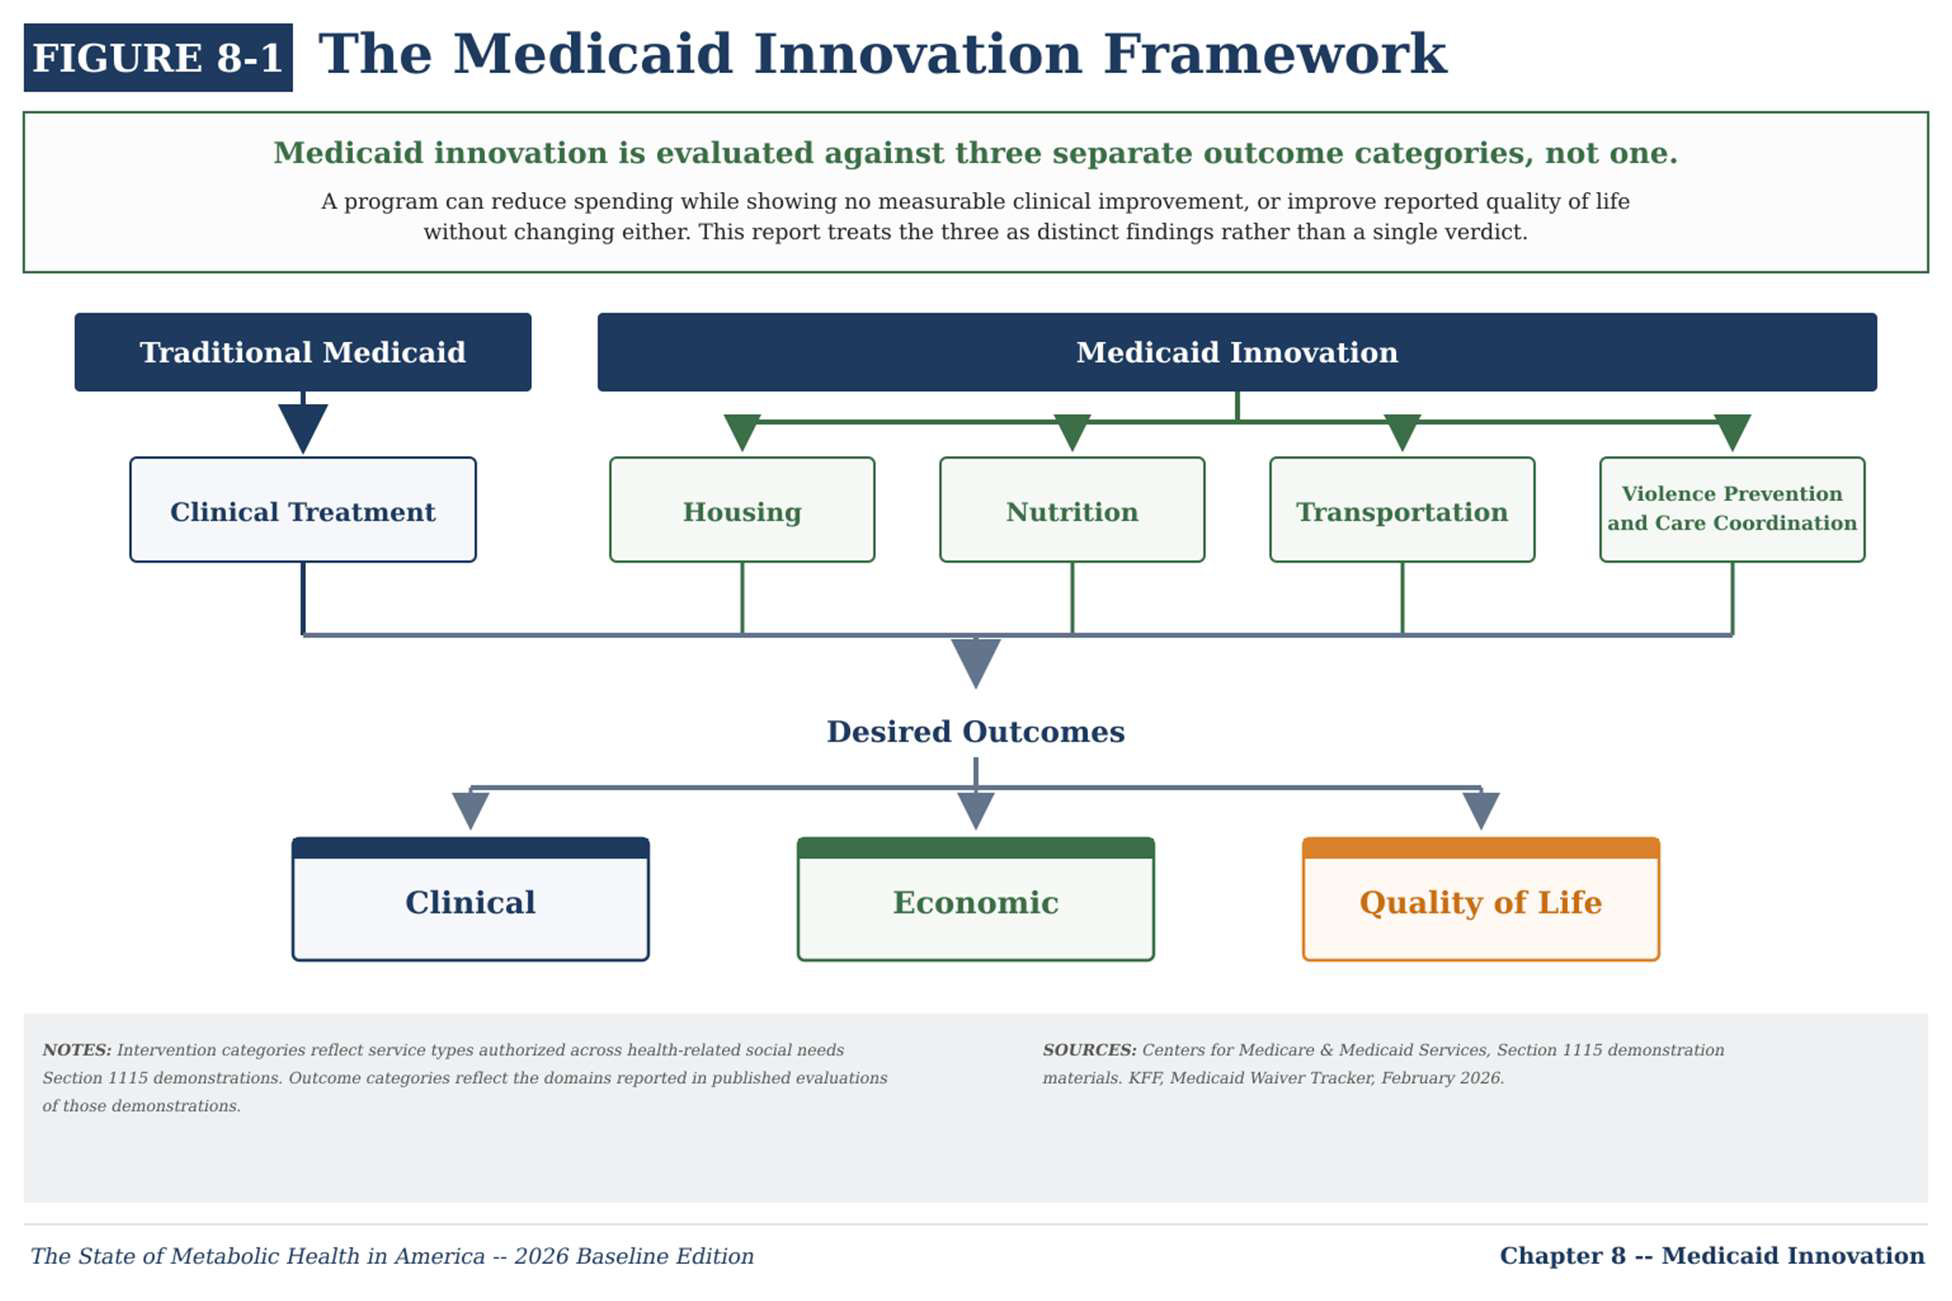
The interconnected chain of federal, state, and local public health funding and surveillance systems that track metabolic health. Chapter 8 — Medicaid Innovation Figure 8-1 The Medicaid Innovation Framework
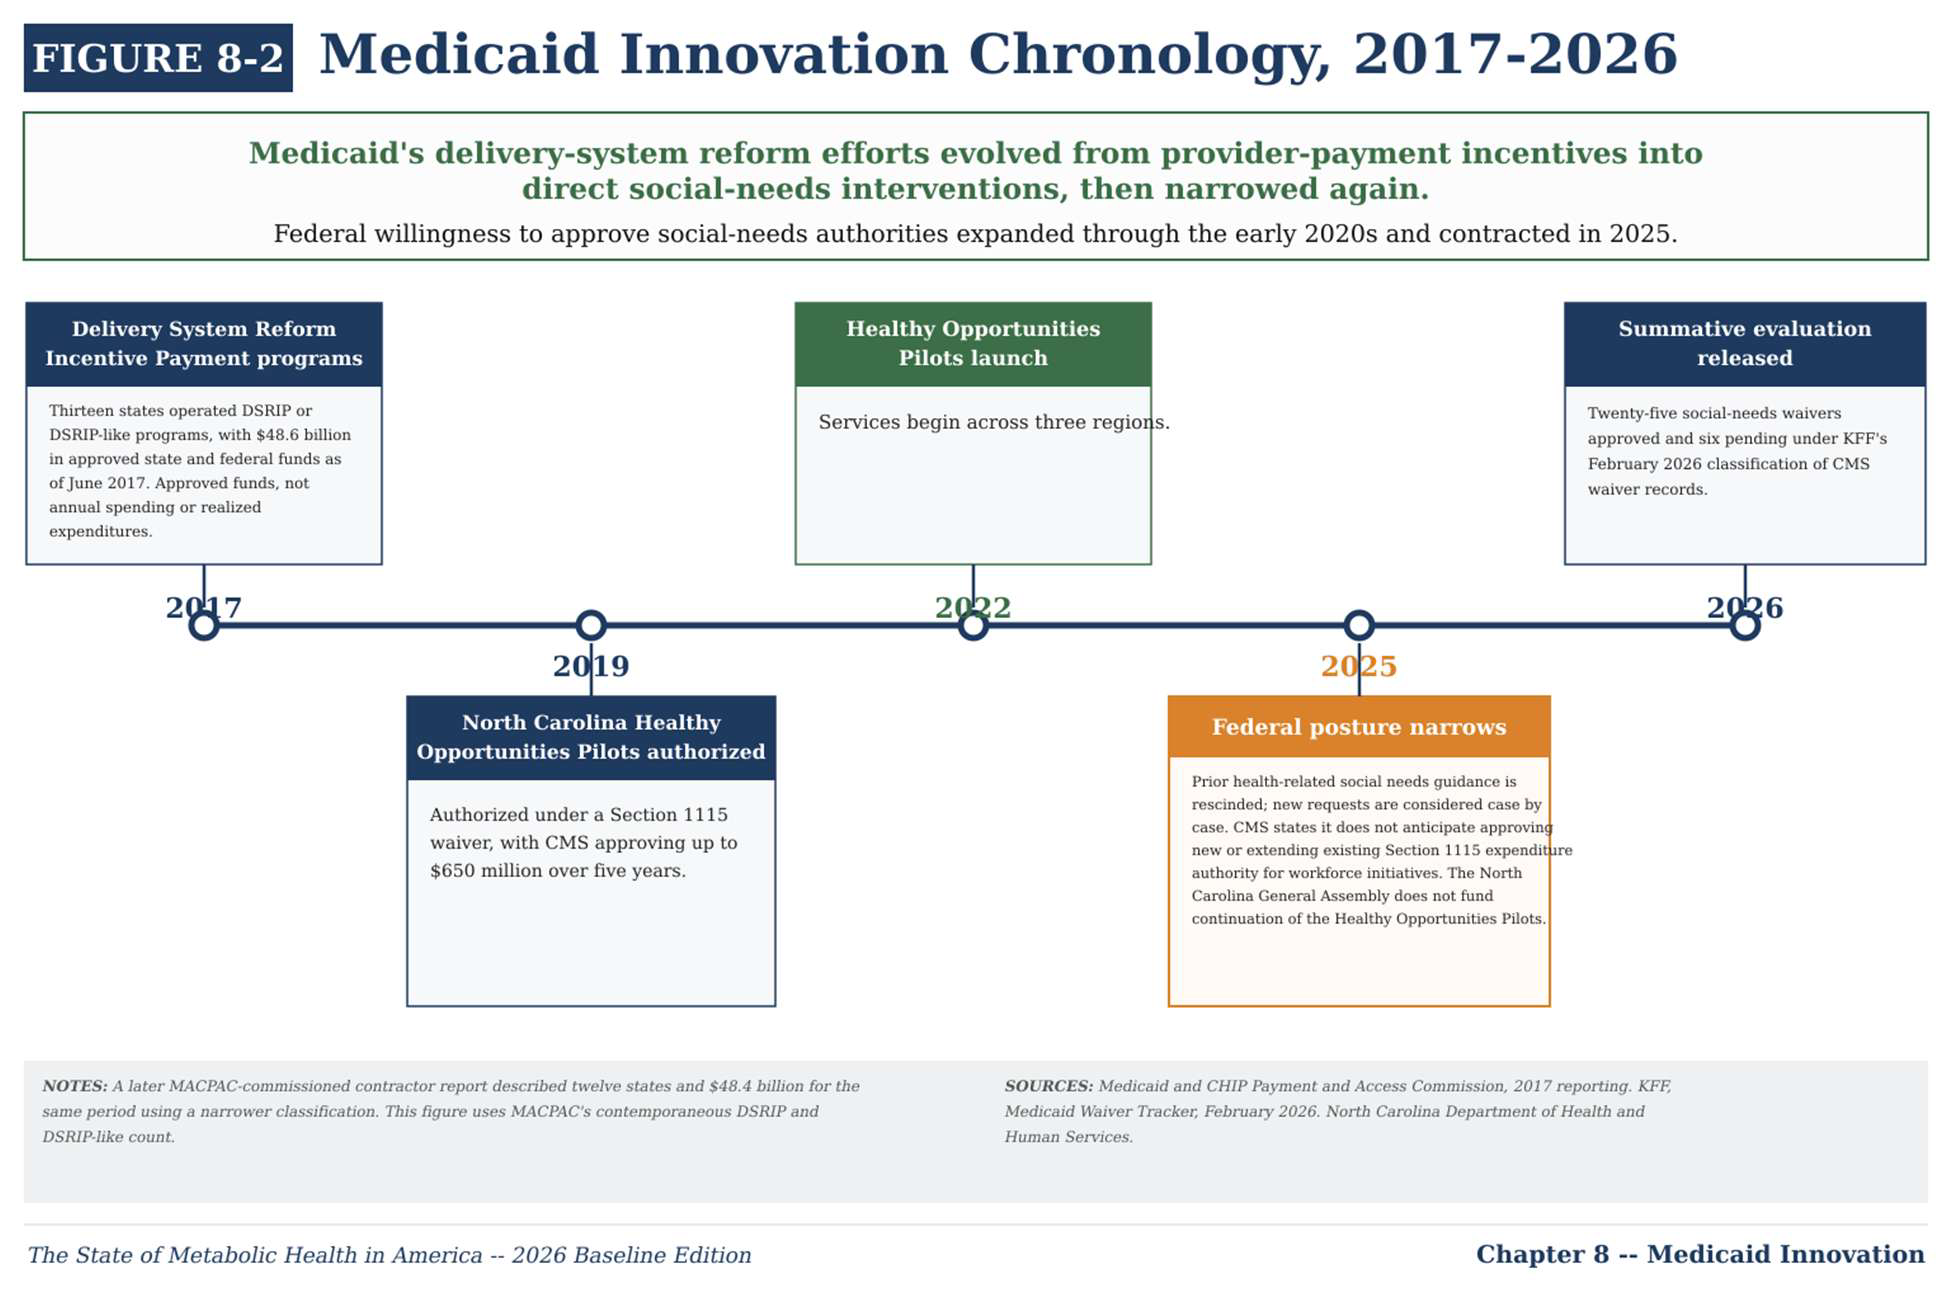
A framework for categorizing Medicaid innovation initiatives by intervention type and outcome domain for metabolic health. Figure 8-2 Medicaid Innovation Chronology, 2017–2026
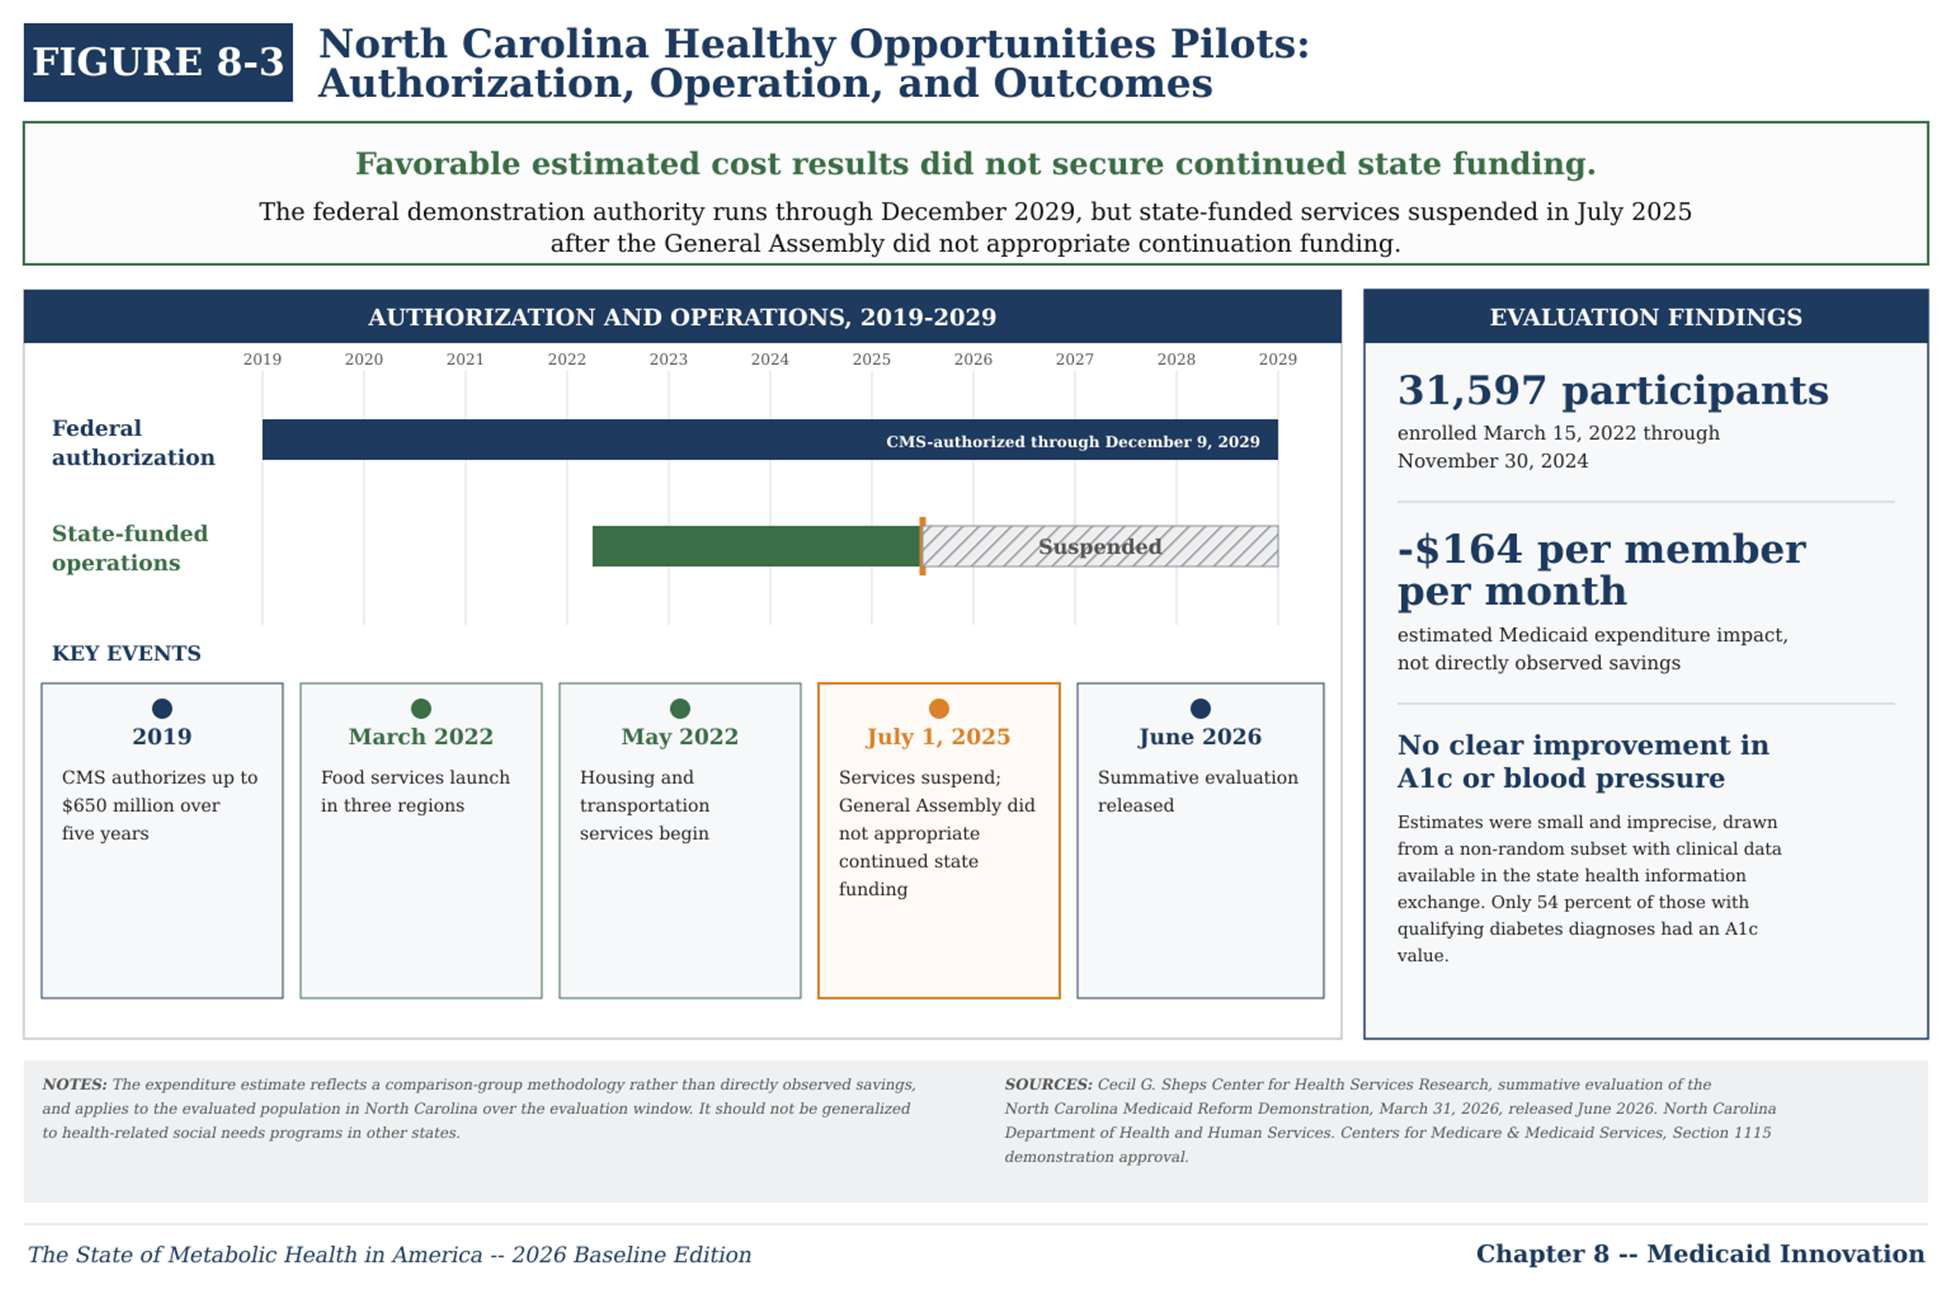
Timeline of major Medicaid innovation milestones from 2017 through 2026, including DSRIP programs and Section 1115 demonstrations. Figure 8-3 North Carolina Healthy Opportunities Pilots: Authorization, Operation, and Outcomes
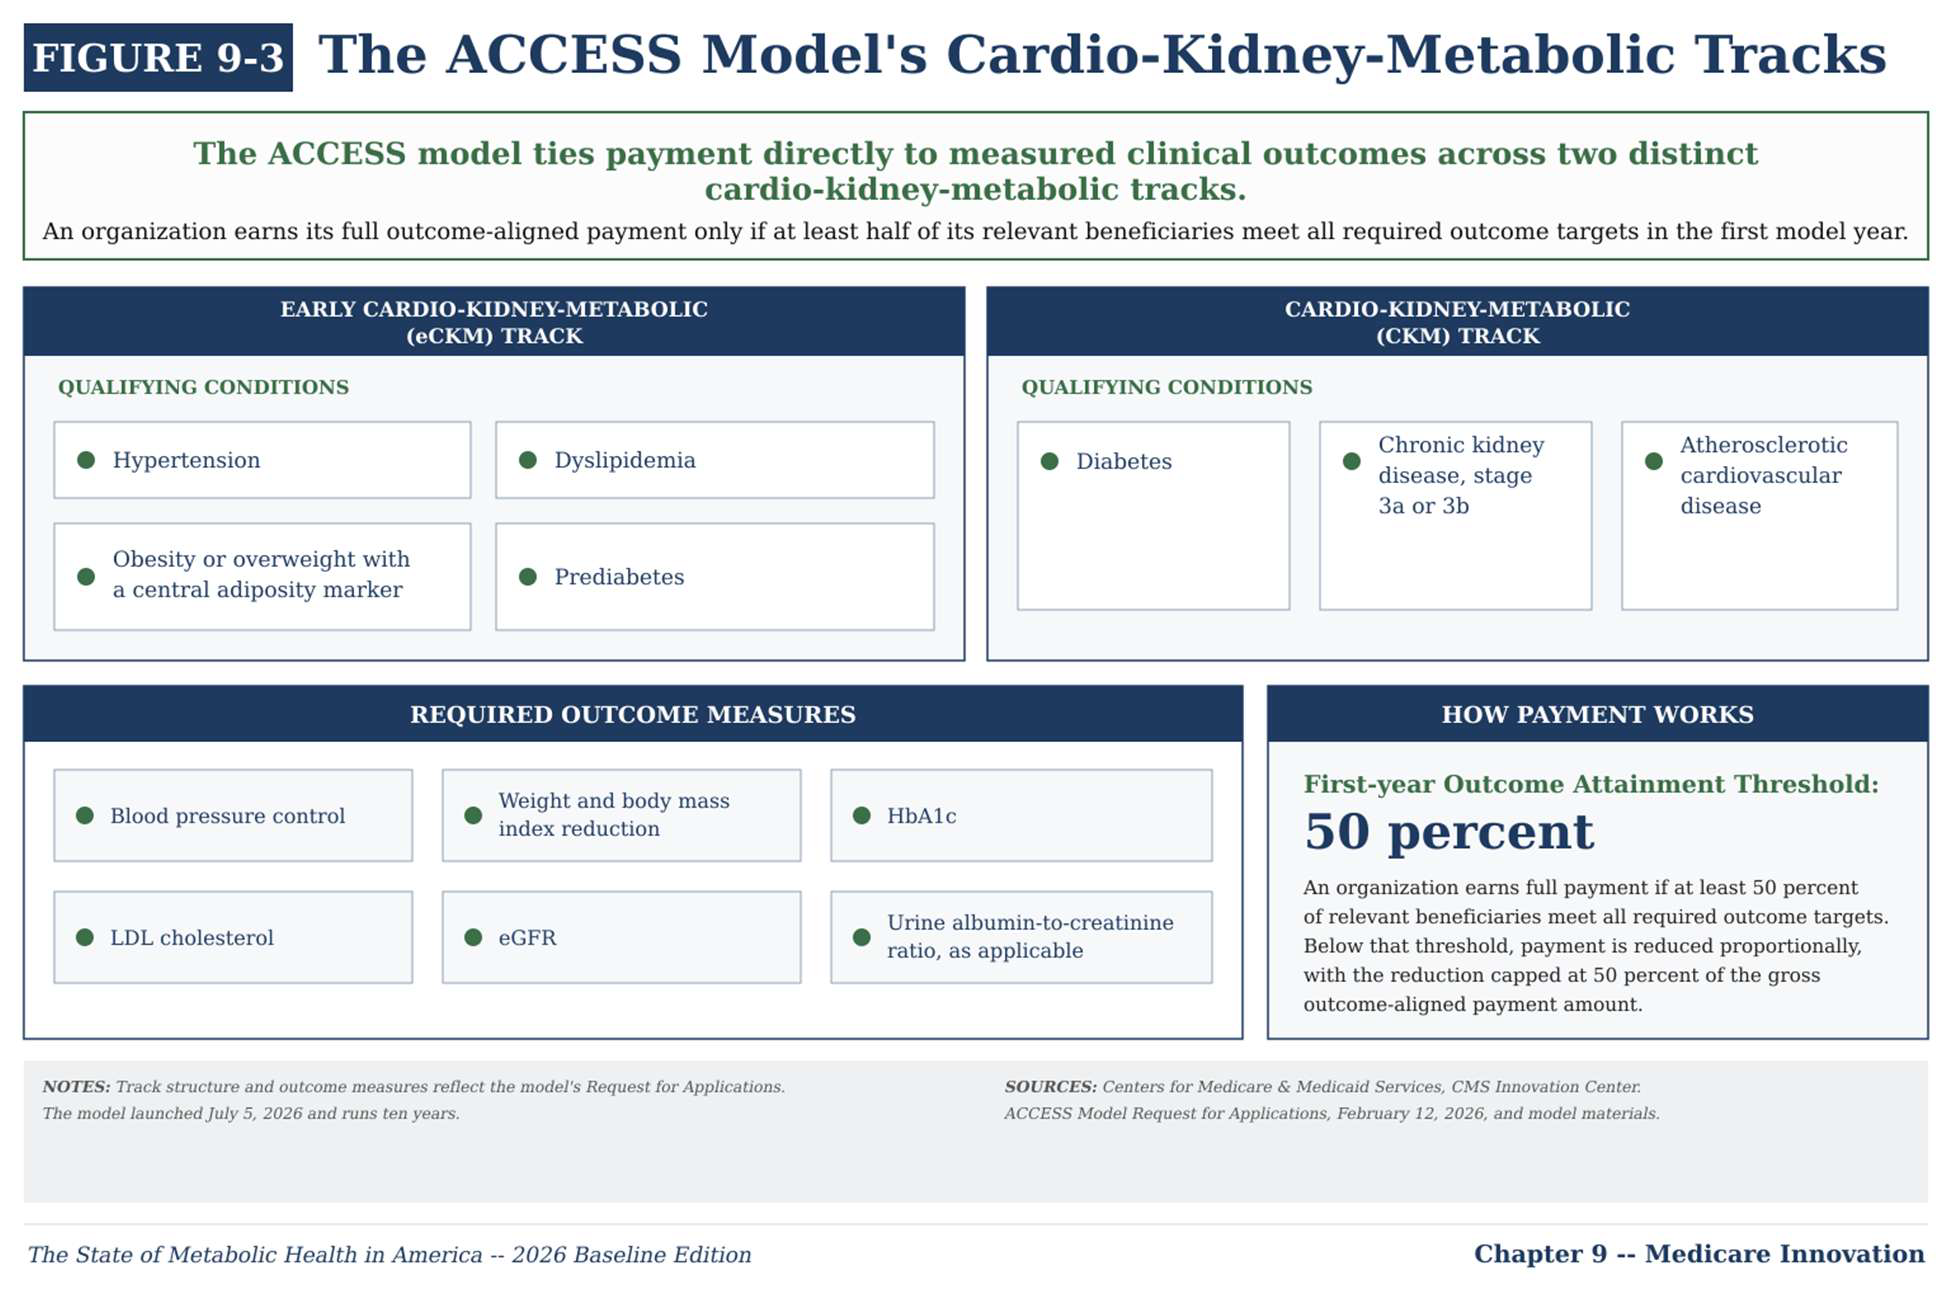
Overview of the North Carolina Healthy Opportunities Pilots program, its authorization, operational scope, and health outcome results. Chapter 9 — Medicare Innovation Figure 9-3 The ACCESS Model's Cardio-Kidney-Metabolic Tracks
Structure of the CMS ACCESS model's cardio-kidney-metabolic payment tracks, launched July 2026 and running ten years. Figures reproduced from
The State of Metabolic Health in America, 2026 Baseline Edition . Licensed under
CC BY 4.0 . Full source citations and methodology notes are available in the
complete PDF report .